
Seller's Agent in 2021
Bart Rosenberg
Sibcy Cline
(513) 417-0882
1 in this area
12 Total Sales

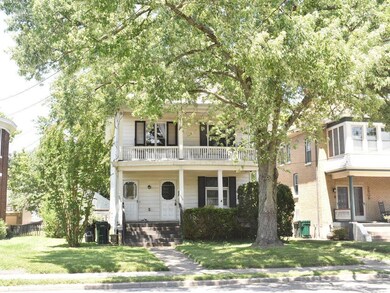

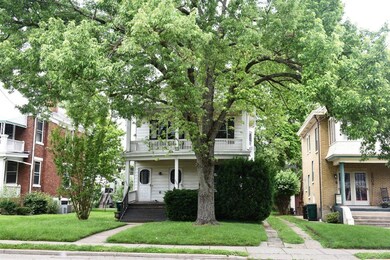
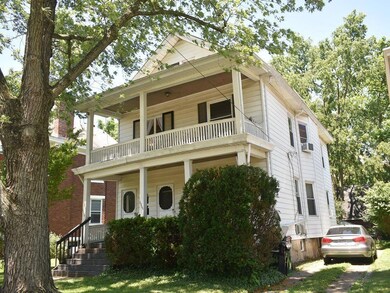

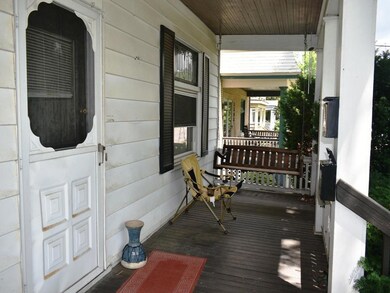
Rare 3 unit building in Hyde Park. Live in one unit and rent two others. Hdwd floors, deck, two porches, off-street parking, fenced rear yard, full basement. Three wndw a/c, 3 refrig, 2 stoves incl. Tenants pay gas & elec. Two 2BR, one 1BR. Newer furn & H20. Near all that HP square has to offer. Beautiful inop fireplaces. Sells AS-IS; no FHA/VA.
Last Agent to Sell the Property
Sibcy Cline, Inc. License #2004016867 Listed on: 06/16/2021
| Date | Event | Price | List to Sale | Price per Sq Ft |
|---|---|---|---|---|
| 11/29/2021 11/29/21 | Off Market | $410,000 | -- | -- |
| 08/30/2021 08/30/21 | Sold | $410,000 | -25.3% | $171 / Sq Ft |
| 08/12/2021 08/12/21 | Pending | -- | -- | -- |
| 06/16/2021 06/16/21 | For Sale | $549,000 | -- | $229 / Sq Ft |
| Year | Tax Paid | Tax Assessment Tax Assessment Total Assessment is a certain percentage of the fair market value that is determined by local assessors to be the total taxable value of land and additions on the property. | Land | Improvement |
|---|---|---|---|---|
| 2025 | $10,836 | $171,021 | $83,237 | $87,784 |
| 2024 | $10,821 | $171,021 | $83,237 | $87,784 |
| 2023 | $10,840 | $171,021 | $83,237 | $87,784 |
| 2022 | $8,745 | $124,079 | $60,792 | $63,287 |
| 2021 | $8,596 | $124,079 | $60,792 | $63,287 |
| 2020 | $8,621 | $124,079 | $60,792 | $63,287 |
| 2019 | $8,165 | $106,964 | $52,406 | $54,558 |
| 2018 | $8,171 | $106,964 | $52,406 | $54,558 |
| 2017 | $7,870 | $106,964 | $52,406 | $54,558 |
| 2016 | $6,200 | $82,167 | $42,620 | $39,547 |
| 2015 | $5,541 | $82,167 | $42,620 | $39,547 |
| 2014 | $5,571 | $82,167 | $42,620 | $39,547 |
| 2013 | $5,503 | $79,772 | $41,377 | $38,395 |
Seller's Agent in 2021
Bart Rosenberg
Sibcy Cline
(513) 417-0882
1 in this area
12 Total Sales
Buyer's Agent in 2021
James Pitzer
Coldwell Banker Realty
(513) 225-3069
5 in this area
253 Total Sales
Source: MLS of Greater Cincinnati (CincyMLS)
MLS Number: 1704352
APN: 040-0006-0123-00
Disclaimer: Certain information contained herein is derived from information provided by parties other than Homes.com. All information provided is deemed reliable, but is not guaranteed to be accurate and should be independently verified.
![]() The data relating to real estate for sale on this website comes in part from the Broker Reciprocity programs of the MLS of Greater Cincinnati, Inc.. Those listings held by brokerage firms other than Ten-X are marked with the Broker Reciprocity logo and house icon. The properties displayed may not be all of the properties available through Broker Reciprocity.
The data relating to real estate for sale on this website comes in part from the Broker Reciprocity programs of the MLS of Greater Cincinnati, Inc.. Those listings held by brokerage firms other than Ten-X are marked with the Broker Reciprocity logo and house icon. The properties displayed may not be all of the properties available through Broker Reciprocity.
IDX information is provided exclusively for personal, non-commercial use, and may not be used for any purpose other than to identify prospective properties consumers may be interested in purchasing.
Information is deemed reliable but not guaranteed.
Ten-X does not display the entire Cincinnati MLS Broker Reciprocity™ database on this web site. The listings of some real estate brokerage firms have been excluded.
Copyright 2026, MLS of Greater Cincinnati, Inc. All rights reserved
Ask me questions while you tour the home.