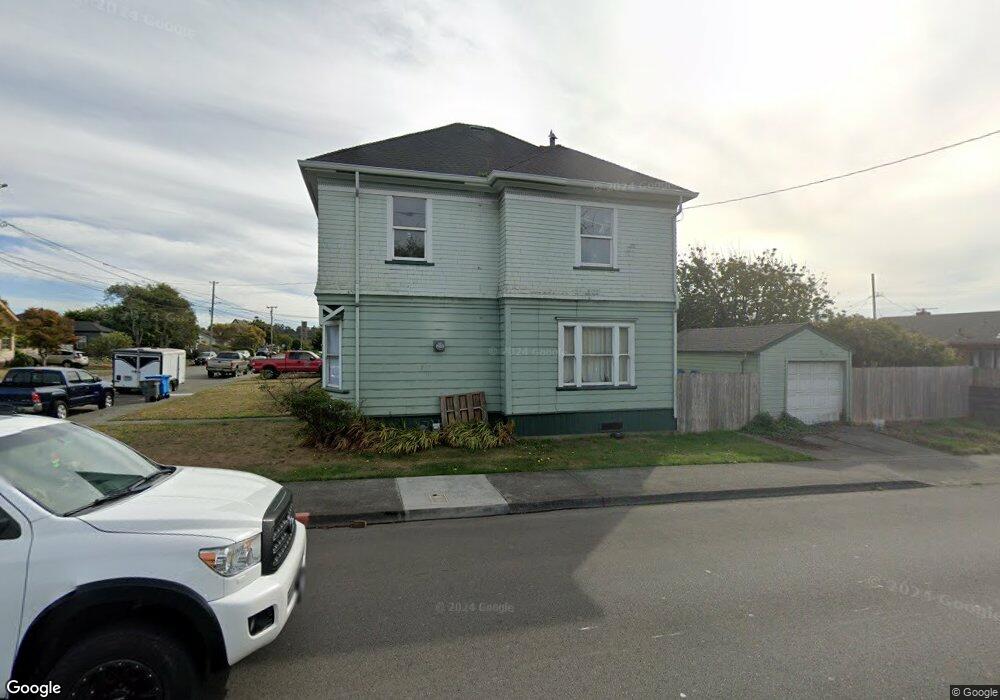
2804 Williams St Eureka, CA 95501
Fairfield NeighborhoodEstimated Value: $346,204 - $432,000
4
Beds
2
Baths
1,800
Sq Ft
$220/Sq Ft
Est. Value
About This Home
This home is located at 2804 Williams St, Eureka, CA 95501 and is currently estimated at $396,801, approximately $220 per square foot. 2804 Williams St is a home located in Humboldt County with nearby schools including Grant Elementary School, Winship Middle School, and Eureka Senior High School.
Ownership History
Date
Name
Owned For
Owner Type
Purchase Details
Closed on
Oct 15, 2024
Sold by
Shealor Kenneth G and Shealor Lesa D
Bought by
Kenneth And Lesa Shealor 2024 Trust and Shealor
Current Estimated Value
Purchase Details
Closed on
Feb 27, 2002
Sold by
Va
Bought by
Shealor Kenneth G and Shealor Lesa D
Home Financials for this Owner
Home Financials are based on the most recent Mortgage that was taken out on this home.
Original Mortgage
$126,000
Interest Rate
6.8%
Mortgage Type
Purchase Money Mortgage
Purchase Details
Closed on
Nov 23, 1998
Sold by
Henniger Waldemar Fred and Henniger Lesley A
Bought by
Va
Purchase Details
Closed on
Mar 18, 1997
Sold by
Demeire Paul Michael and Demeire Judith Pella
Bought by
Backerman Steven R and Backerman Susan L
Home Financials for this Owner
Home Financials are based on the most recent Mortgage that was taken out on this home.
Original Mortgage
$85,300
Interest Rate
7.96%
Mortgage Type
Purchase Money Mortgage
Create a Home Valuation Report for This Property
The Home Valuation Report is an in-depth analysis detailing your home's value as well as a comparison with similar homes in the area
Home Values in the Area
Average Home Value in this Area
Purchase History
| Date | Buyer | Sale Price | Title Company |
|---|---|---|---|
| Kenneth And Lesa Shealor 2024 Trust | -- | None Listed On Document | |
| Shealor Kenneth G | -- | Fidelity National Title | |
| Va | -- | Humboldt Land Title Company | |
| Henniger Waldemar Fred | -- | Humboldt Land Title Company | |
| Backerman Steven R | $107,000 | Humboldt Land Title Company |
Source: Public Records
Mortgage History
| Date | Status | Borrower | Loan Amount |
|---|---|---|---|
| Previous Owner | Shealor Kenneth G | $126,000 | |
| Previous Owner | Backerman Steven R | $85,300 |
Source: Public Records
Tax History
| Year | Tax Paid | Tax Assessment Tax Assessment Total Assessment is a certain percentage of the fair market value that is determined by local assessors to be the total taxable value of land and additions on the property. | Land | Improvement |
|---|---|---|---|---|
| 2025 | $2,127 | $206,794 | $51,691 | $155,103 |
| 2024 | $2,127 | $202,740 | $50,678 | $152,062 |
| 2023 | $2,097 | $198,766 | $49,685 | $149,081 |
| 2022 | $2,177 | $194,869 | $48,711 | $146,158 |
| 2021 | $2,039 | $191,049 | $47,756 | $143,293 |
| 2020 | $2,023 | $189,091 | $47,267 | $141,824 |
| 2019 | $1,982 | $185,385 | $46,341 | $139,044 |
| 2018 | $1,952 | $181,751 | $45,433 | $136,318 |
| 2017 | $1,942 | $178,189 | $44,543 | $133,646 |
| 2016 | $1,943 | $174,696 | $43,670 | $131,026 |
| 2015 | $1,926 | $172,073 | $43,015 | $129,058 |
| 2014 | $1,800 | $168,703 | $42,173 | $126,530 |
Source: Public Records
Map
Nearby Homes
- 2812 Williams St
- 2805 Lowell St
- 2820 Williams St
- 2821 Lowell St
- 2801 Williams St
- 2805 Williams St
- 2829 Lowell St
- 0 Lowell St
- 2836 Williams St
- 2809 Williams St
- 2837 Lowell St
- 2806 Lowell St
- 2833 Williams St
- 2844 Williams St
- 2820 Lowell St
- 2845 Lowell St
- 2841 Williams St
- 2852 Williams St
- 2804 D St
- 2818 D St
Your Personal Tour Guide
Ask me questions while you tour the home.