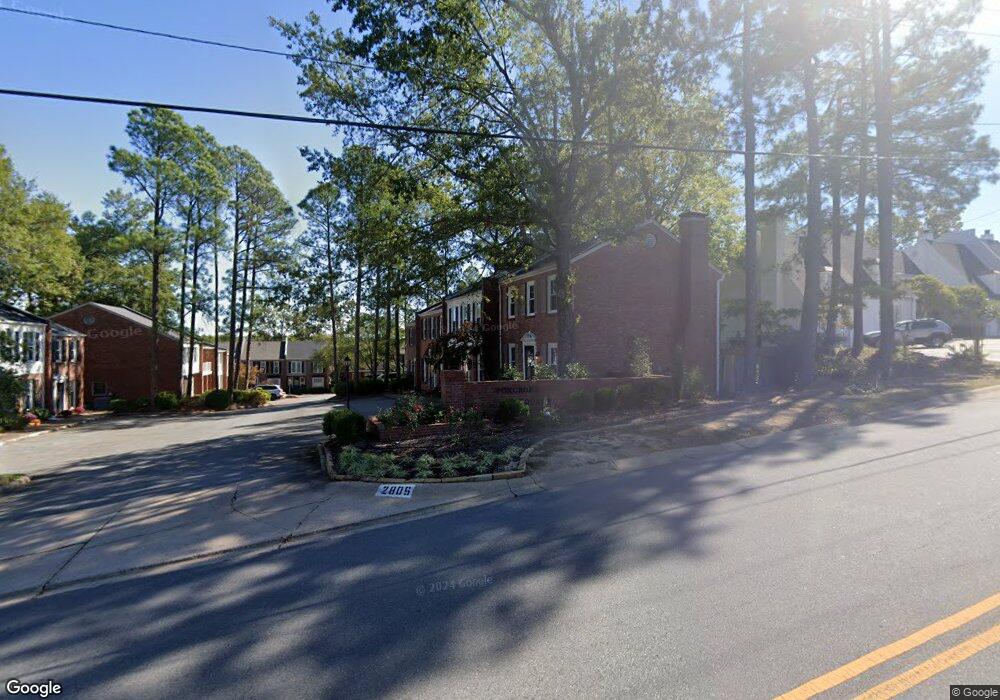
2805 Foxcroft Rd Unit 902 Little Rock, AR 72227
Foxcroft NeighborhoodEstimated Value: $183,000 - $196,000
--
Bed
4
Baths
1,364
Sq Ft
$140/Sq Ft
Est. Value
About This Home
This home is located at 2805 Foxcroft Rd Unit 902, Little Rock, AR 72227 and is currently estimated at $191,173, approximately $140 per square foot. 2805 Foxcroft Rd Unit 902 is a home located in Pulaski County with nearby schools including Jefferson Elementary School, Pulaski Heights Middle School, and Central High School.
Ownership History
Date
Name
Owned For
Owner Type
Purchase Details
Closed on
Jun 3, 2024
Sold by
Franks Tullos Louis
Bought by
Holbert Scott Taylor
Current Estimated Value
Home Financials for this Owner
Home Financials are based on the most recent Mortgage that was taken out on this home.
Original Mortgage
$148,000
Outstanding Balance
$145,908
Interest Rate
7.17%
Mortgage Type
New Conventional
Estimated Equity
$45,265
Purchase Details
Closed on
Jul 31, 2020
Sold by
Gerald Nesbitt Trust and Nesbitt Gerald
Bought by
Franks Tripp
Home Financials for this Owner
Home Financials are based on the most recent Mortgage that was taken out on this home.
Original Mortgage
$140,125
Interest Rate
3.1%
Mortgage Type
New Conventional
Purchase Details
Closed on
Sep 29, 2006
Sold by
Nesbitt Gerald and Nesbitt Juanita Brown
Bought by
Nesbitt Gerald
Create a Home Valuation Report for This Property
The Home Valuation Report is an in-depth analysis detailing your home's value as well as a comparison with similar homes in the area
Home Values in the Area
Average Home Value in this Area
Purchase History
| Date | Buyer | Sale Price | Title Company |
|---|---|---|---|
| Holbert Scott Taylor | $185,000 | Attorneys Title Group | |
| Franks Tripp | $147,500 | Attorneys Title Group Llc | |
| Nesbitt Gerald | -- | None Available |
Source: Public Records
Mortgage History
| Date | Status | Borrower | Loan Amount |
|---|---|---|---|
| Open | Holbert Scott Taylor | $148,000 | |
| Previous Owner | Franks Tripp | $140,125 |
Source: Public Records
Tax History Compared to Growth
Tax History
| Year | Tax Paid | Tax Assessment Tax Assessment Total Assessment is a certain percentage of the fair market value that is determined by local assessors to be the total taxable value of land and additions on the property. | Land | Improvement |
|---|---|---|---|---|
| 2025 | $2,043 | $29,185 | -- | $29,185 |
| 2024 | $2,043 | $29,185 | -- | $29,185 |
| 2023 | $2,043 | $29,185 | $0 | $29,185 |
| 2022 | $2,041 | $29,185 | $0 | $29,185 |
| 2021 | $1,957 | $27,760 | $0 | $27,760 |
| 2020 | $1,568 | $27,760 | $0 | $27,760 |
| 2019 | $1,943 | $27,760 | $0 | $27,760 |
| 2018 | $1,943 | $27,760 | $0 | $27,760 |
| 2017 | $1,943 | $27,760 | $0 | $27,760 |
| 2016 | $2,100 | $30,000 | $0 | $30,000 |
| 2015 | $2,103 | $30,000 | $0 | $30,000 |
| 2014 | $2,103 | $30,000 | $0 | $30,000 |
Source: Public Records
Map
Nearby Homes
- 2801 Foxcroft Rd
- 26 Foxcroft Village Dr
- 6 White Oak Cir
- 3118 Foxcroft Rd
- 22 White Oak Cir
- 8 Racquet Ct
- 26 Tallyho Ln
- 15 Indian Trail
- 48 Woodglen Rd
- 40 Woodglen Rd
- 52 Woodglen Rd
- 2200 Andover Ct
- 2 White Oak Ln
- 34 Woodglen Rd
- 17 Woodglen Rd
- 19 Woodglen Rd
- 21 Woodglen Rd
- 11 Delray Dr
- 15 Woodglen Rd
- 23 Woodglen Rd
- 2805 Foxcroft Rd
- 2805 Foxcroft Rd Unit 1003
- 2805 Foxcroft Rd Unit 1002
- 2805 Foxcroft Rd Unit 1001
- 2805 Foxcroft Rd Unit 903
- 2805 Foxcroft Rd Unit 901
- 2805 Foxcroft Rd Unit 803
- 2805 Foxcroft Rd Unit 802
- 2805 Foxcroft Rd Unit 801
- 2805 Foxcroft Rd Unit 704
- 2805 Foxcroft Rd Unit 703
- 2805 Foxcroft Rd Unit 702
- 2805 Foxcroft Rd Unit 701
- 2805 Foxcroft Rd Unit 604
- 2805 Foxcroft Rd Unit 603
- 2805 Foxcroft Rd Unit 602
- 2805 Foxcroft Rd Unit 601
- 2805 Foxcroft Rd Unit 503
- 2805 Foxcroft Rd Unit 502
- 2805 Foxcroft Rd Unit 501