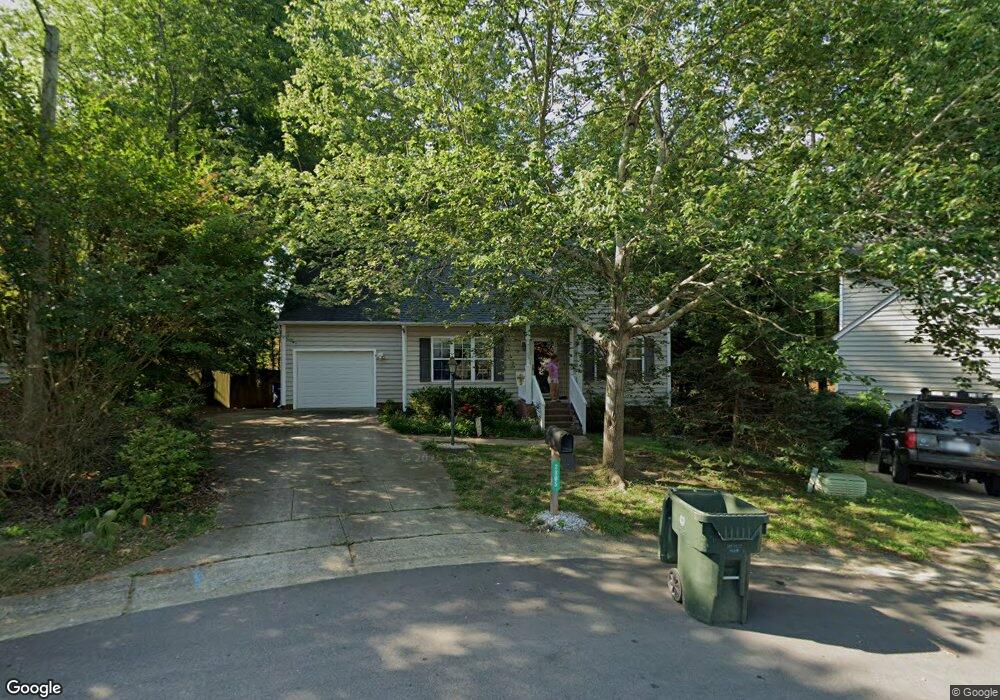
2805 Lower Dry Falls Ct Raleigh, NC 27603
South Raleigh NeighborhoodEstimated Value: $439,000 - $459,651
3
Beds
3
Baths
1,720
Sq Ft
$259/Sq Ft
Est. Value
About This Home
This home is located at 2805 Lower Dry Falls Ct, Raleigh, NC 27603 and is currently estimated at $445,413, approximately $258 per square foot. 2805 Lower Dry Falls Ct is a home located in Wake County with nearby schools including Dillard Drive Magnet Elementary School, Dillard Drive Magnet Middle School, and Longleaf School Of The Arts.
Ownership History
Date
Name
Owned For
Owner Type
Purchase Details
Closed on
Sep 25, 2015
Sold by
Hargis Candace L and Lynn Candace Marie
Bought by
Xu Hong and Zhao Yijia
Current Estimated Value
Purchase Details
Closed on
Feb 3, 2006
Sold by
Schoonover Kevin R
Bought by
Hargis Candace L
Home Financials for this Owner
Home Financials are based on the most recent Mortgage that was taken out on this home.
Original Mortgage
$28,425
Interest Rate
6.21%
Mortgage Type
Credit Line Revolving
Purchase Details
Closed on
Apr 29, 2003
Sold by
Reuss Scott and Reus Valerie
Bought by
Schoonover Kevin R
Home Financials for this Owner
Home Financials are based on the most recent Mortgage that was taken out on this home.
Original Mortgage
$126,800
Interest Rate
4.25%
Purchase Details
Closed on
Jul 23, 1999
Sold by
Murdock & Gannon Construction Inc
Bought by
Reuss Scott and Reuss Valerie
Home Financials for this Owner
Home Financials are based on the most recent Mortgage that was taken out on this home.
Original Mortgage
$155,573
Interest Rate
7.51%
Mortgage Type
FHA
Create a Home Valuation Report for This Property
The Home Valuation Report is an in-depth analysis detailing your home's value as well as a comparison with similar homes in the area
Home Values in the Area
Average Home Value in this Area
Purchase History
| Date | Buyer | Sale Price | Title Company |
|---|---|---|---|
| Xu Hong | $200,000 | Attorney | |
| Hargis Candace L | $189,500 | None Available | |
| Schoonover Kevin R | $158,500 | -- | |
| Reuss Scott | $156,000 | -- |
Source: Public Records
Mortgage History
| Date | Status | Borrower | Loan Amount |
|---|---|---|---|
| Previous Owner | Hargis Candace L | $28,425 | |
| Previous Owner | Hargis Candace L | $151,600 | |
| Previous Owner | Schoonover Kevin R | $126,800 | |
| Previous Owner | Reuss Scott | $155,573 |
Source: Public Records
Tax History Compared to Growth
Tax History
| Year | Tax Paid | Tax Assessment Tax Assessment Total Assessment is a certain percentage of the fair market value that is determined by local assessors to be the total taxable value of land and additions on the property. | Land | Improvement |
|---|---|---|---|---|
| 2025 | $3,694 | $421,274 | $160,000 | $261,274 |
| 2024 | $3,679 | $421,274 | $160,000 | $261,274 |
| 2023 | $3,089 | $281,563 | $60,000 | $221,563 |
| 2022 | $2,871 | $281,563 | $60,000 | $221,563 |
| 2021 | $2,760 | $281,563 | $60,000 | $221,563 |
| 2020 | $2,709 | $281,563 | $60,000 | $221,563 |
| 2019 | $2,377 | $203,350 | $54,000 | $149,350 |
| 2018 | $2,242 | $203,350 | $54,000 | $149,350 |
| 2017 | $2,135 | $203,350 | $54,000 | $149,350 |
| 2016 | $0 | $203,350 | $54,000 | $149,350 |
| 2015 | -- | $197,082 | $48,000 | $149,082 |
| 2014 | $1,955 | $197,082 | $48,000 | $149,082 |
Source: Public Records
Map
Nearby Homes
- 2816 Alder Ridge Ln
- 2901 Alder Ridge Ln
- 2505 Ferndown Ct
- 2639 Broad Oaks Place Unit 21
- 2524 Ferndown Ct
- 2607 Sterling Park Dr
- 2621 Ivory Run Way Unit 105
- 2528 Beech Gap Ct
- 2636 Scattered Oak Ct
- 3113 Henslowe Dr
- 2831 Barrymore St Unit 107
- 2201 Mountain Mist Ct Unit 103
- 2221 Mountain Mist Ct Unit 201
- 2271 Trailwood Valley Cir
- 2920 Barrymore St Unit 106
- 3109 Tryon Rd
- 3113 Tryon Rd
- 3115 Tryon Rd
- 2108 Leadenhall Way
- 1901 Trailwood Heights Ln Unit 304
- 2801 Lower Dry Falls Ct
- 2809 Lower Dryer Falls Ct
- 2809 Lower Dry Falls Ct
- 2620 Farlow Gap Ln
- 2808 Lower Dry Falls Ct
- 2800 Lower Dryer Falls Ct
- 2624 Farlow Gap Ln
- 2800 Lower Dry Falls Ct
- 2418 Kirk Ave
- 2621 Farlow Gap Ln
- 2804 Lower Dry Falls Ct
- 2617 Farlow Gap Ln
- 2628 Farlow Gap Ln
- 2625 Farlow Gap Ln
- 2604 Farlow Gap Ln
- 2725 Upper Dry Falls Ct
- 2813 Alder Ridge Ln
- 2629 Farlow Gap Ln
- 2809 Alder Ridge Ln
- 2805 Alder Ridge Ln