Estimated Value: $867,000 - $1,311,000
4
Beds
4
Baths
4,424
Sq Ft
$262/Sq Ft
Est. Value
About This Home
This home is located at 2805 Oak Way, Chico, CA 95973 and is currently estimated at $1,161,084, approximately $262 per square foot. 2805 Oak Way is a home located in Butte County with nearby schools including Emma Wilson Elementary School, Chico Junior High School, and Chico High School.
Ownership History
Date
Name
Owned For
Owner Type
Purchase Details
Closed on
Mar 27, 2019
Sold by
Wallace Michael and Mathews Wallace Sharon
Bought by
Wallace Michael P and Wallace Sharon Y
Current Estimated Value
Purchase Details
Closed on
Jun 23, 2009
Sold by
Disano Michael J and Porter Cathy A
Bought by
Wallace Michael and Mathews Wallace Sharon
Home Financials for this Owner
Home Financials are based on the most recent Mortgage that was taken out on this home.
Original Mortgage
$687,000
Outstanding Balance
$435,459
Interest Rate
4.83%
Mortgage Type
Unknown
Estimated Equity
$725,625
Purchase Details
Closed on
Nov 2, 1998
Sold by
Disano Michael J
Bought by
Disano Cathy A
Home Financials for this Owner
Home Financials are based on the most recent Mortgage that was taken out on this home.
Original Mortgage
$150,530
Interest Rate
6.61%
Create a Home Valuation Report for This Property
The Home Valuation Report is an in-depth analysis detailing your home's value as well as a comparison with similar homes in the area
Purchase History
| Date | Buyer | Sale Price | Title Company |
|---|---|---|---|
| Wallace Michael P | -- | None Available | |
| Wallace Michael | $685,000 | Mid Valley Title & Escrow Co | |
| Disano Cathy A | -- | Mid Valley Title & Escrow Co |
Source: Public Records
Mortgage History
| Date | Status | Borrower | Loan Amount |
|---|---|---|---|
| Open | Wallace Michael | $687,000 | |
| Previous Owner | Disano Cathy A | $150,530 |
Source: Public Records
Tax History
| Year | Tax Paid | Tax Assessment Tax Assessment Total Assessment is a certain percentage of the fair market value that is determined by local assessors to be the total taxable value of land and additions on the property. | Land | Improvement |
|---|---|---|---|---|
| 2025 | $9,846 | $907,602 | $289,739 | $617,863 |
| 2024 | $9,846 | $889,807 | $284,058 | $605,749 |
| 2023 | $9,452 | $847,851 | $278,489 | $569,362 |
| 2022 | $9,296 | $831,228 | $273,029 | $558,199 |
| 2021 | $9,121 | $814,930 | $267,676 | $547,254 |
| 2020 | $9,095 | $806,575 | $264,932 | $541,643 |
| 2019 | $8,930 | $790,761 | $259,738 | $531,023 |
| 2018 | $8,767 | $775,257 | $254,646 | $520,611 |
| 2017 | $8,590 | $760,056 | $249,653 | $510,403 |
| 2016 | $7,839 | $745,154 | $244,758 | $500,396 |
| 2015 | $7,839 | $733,962 | $241,082 | $492,880 |
| 2014 | $7,650 | $719,586 | $236,360 | $483,226 |
Source: Public Records
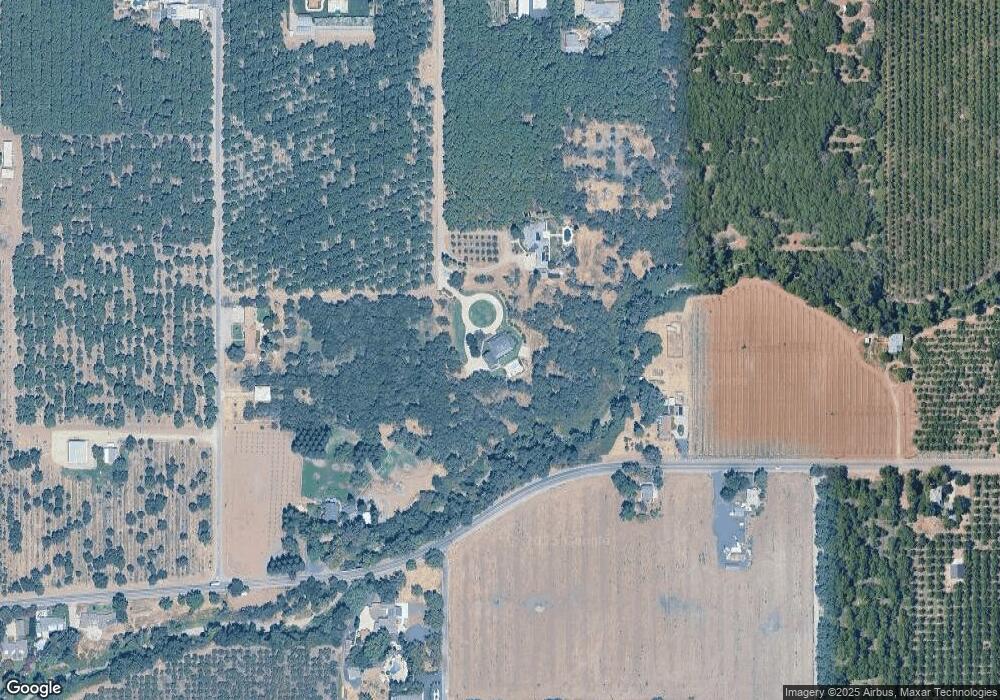
Map
Nearby Homes
- 2725 W Sacramento Ave
- 2787 Grape Way
- 1236 Glenwood Ave
- 1904 Wisteria Ln
- 1 4 Acre Ct
- 2135 Nord Ave Unit 48
- 2135 Nord Ave Unit 40
- Arcadia Plan at Orchard Creek Estates
- Briarwood Plan at Orchard Creek Estates
- Chestnut Plan at Orchard Creek Estates
- Forsythia Plan at Orchard Creek Estates
- 2645 Wesley Way
- 2655 Wesley Way
- 2616 Wesley Way
- 2628 Wesley Way
- 2636 Wesley Way
- 2652 Wesley Way
- 3261 Rodeo Ave
- 3276 Rodeo Ave
- 3310 Rodeo Ave
- 2799 Oak Way
- 2714 W Sacramento Ave
- 2854 W Sacramento Ave
- 1717 Muir Ave
- 2675 W Sacramento Ave
- 47 Grape Way
- 2673 Grape Way
- 2737 Oak Way
- 2604 W Sacramento Ave
- 2763 Oak Way
- 2687 Grape Way
- 2879 Oak Way
- 2711 Grape Way
- 2545 W Sacramento Ave
- 2959 W Sacramento Ave
- 2630 Grape Way
- 2785 Grape Way
- 2662 Oak Way
- 2985 W Sacramento Ave
- 1640 Muir Ave
Your Personal Tour Guide
Ask me questions while you tour the home.