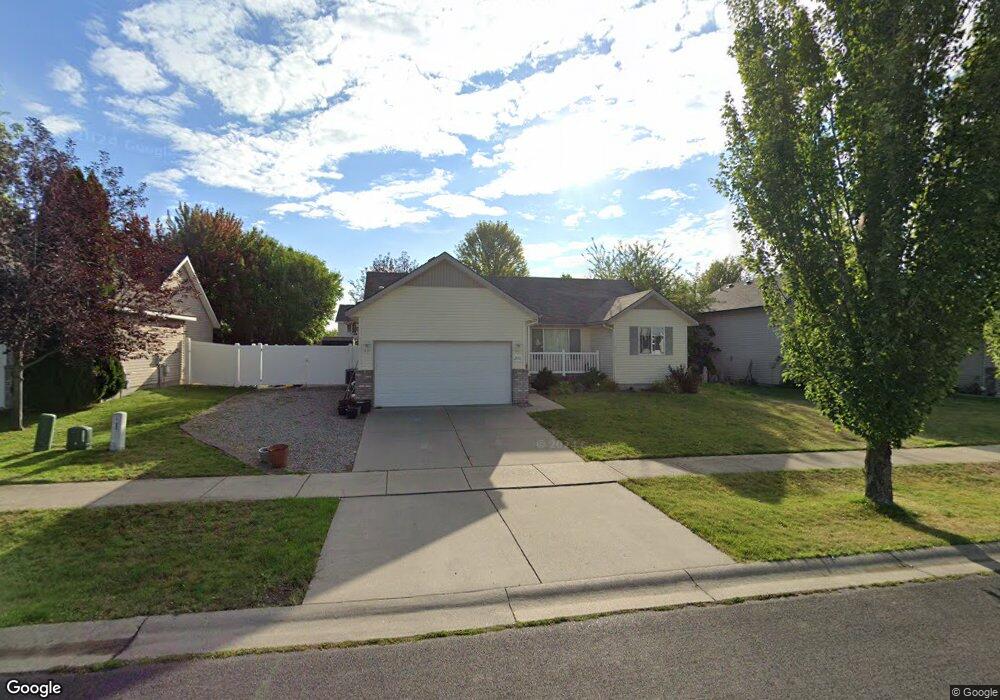
2806 N Ivy Ln Post Falls, ID 83854
North Prairie NeighborhoodEstimated Value: $410,000 - $436,000
3
Beds
2
Baths
1,200
Sq Ft
$353/Sq Ft
Est. Value
About This Home
This home is located at 2806 N Ivy Ln, Post Falls, ID 83854 and is currently estimated at $423,270, approximately $352 per square foot. 2806 N Ivy Ln is a home located in Kootenai County with nearby schools including Prairie View Elementary School, Post Falls Middle School, and Post Falls High School.
Ownership History
Date
Name
Owned For
Owner Type
Purchase Details
Closed on
Mar 30, 2020
Sold by
Grahn Rick L and Grahn Rich
Bought by
Grahn Rick L and Rick L Grahn Revocable Trust
Current Estimated Value
Purchase Details
Closed on
Jun 28, 2019
Sold by
Ross Levi A and Ross Amanda N
Bought by
Grahn Rick L
Purchase Details
Closed on
May 25, 2011
Sold by
Ross Levi A and Ross Amanda N
Bought by
Ross Levi A and Ross Amanda N
Purchase Details
Closed on
Apr 6, 2009
Sold by
Schaefer Roger W and Schaefer Carol A
Bought by
Ross Levi A and Ross Amanda N
Home Financials for this Owner
Home Financials are based on the most recent Mortgage that was taken out on this home.
Original Mortgage
$159,693
Interest Rate
5.06%
Mortgage Type
New Conventional
Purchase Details
Closed on
Feb 14, 2007
Sold by
Schaefer Roger W and Schaefer Carol A
Bought by
Schaefer Roger W and Schaefer Carol A
Create a Home Valuation Report for This Property
The Home Valuation Report is an in-depth analysis detailing your home's value as well as a comparison with similar homes in the area
Home Values in the Area
Average Home Value in this Area
Purchase History
| Date | Buyer | Sale Price | Title Company |
|---|---|---|---|
| Grahn Rick L | -- | Kootenai County Title Co | |
| Grahn Rick L | -- | Kootenai County Title Co | |
| Ross Levi A | -- | -- | |
| Ross Levi A | -- | -- | |
| Schaefer Roger W | -- | -- |
Source: Public Records
Mortgage History
| Date | Status | Borrower | Loan Amount |
|---|---|---|---|
| Previous Owner | Ross Levi A | $159,693 |
Source: Public Records
Tax History Compared to Growth
Tax History
| Year | Tax Paid | Tax Assessment Tax Assessment Total Assessment is a certain percentage of the fair market value that is determined by local assessors to be the total taxable value of land and additions on the property. | Land | Improvement |
|---|---|---|---|---|
| 2024 | $2,391 | $379,350 | $152,000 | $227,350 |
| 2023 | $2,391 | $405,538 | $160,000 | $245,538 |
| 2022 | $2,653 | $430,320 | $157,500 | $272,820 |
| 2021 | $2,759 | $273,090 | $105,000 | $168,090 |
| 2020 | $2,726 | $238,900 | $90,000 | $148,900 |
| 2019 | $1,408 | $207,660 | $90,000 | $117,660 |
| 2018 | $1,288 | $177,310 | $70,000 | $107,310 |
| 2017 | $1,239 | $155,980 | $50,000 | $105,980 |
| 2016 | $1,183 | $140,370 | $40,000 | $100,370 |
| 2015 | $1,174 | $137,120 | $37,000 | $100,120 |
| 2013 | $1,078 | $115,750 | $32,000 | $83,750 |
Source: Public Records
Map
Nearby Homes
- 2416 N Mackenzie Dr
- 2644 N Mackenzie Dr
- 2815 N Sand Trap Way
- 2680 N Top Flight Dr
- 912 E Shasta Ave
- 2815 N Slice Dr
- 2382 N Alfalfa Loop
- Enclave Plan at North Place - East
- Park Ridge Plan at North Place - East
- Windsor Plan at North Place - East
- Avalon Plan at North Place - East
- Cambridge 1662 Plan at North Place - East
- Whistler Plan at North Place - East
- The Cobblestone Plan at North Place - East
- Shoreline 1152 Plan at North Place - East
- Empress Plan at North Place - East
- Shoreline 1312 Plan at North Place - East
- Cambridge 1416 Plan at North Place - East
- Juniper Plan at North Place - East
- Carolina Plan at North Place - East
- 2784 N Ivy Ln
- 2824 N Ivy Ln
- 2844 N Ivy Ln
- 2762 N Ivy Ln
- 2825 N Shooting Star St
- 2805 N Shooting Star St
- 2809 N Ivy Ln
- 2789 N Ivy Ln
- 2843 N Shooting Star St
- 2827 N Ivy Ln
- 2787 N Shooting Star St
- 2771 N Ivy Ln
- 2863 Shooting Star St
- 2864 N Ivy Ln
- 2738 N Ivy Ln
- 2845 N Ivy Ln
- 2869 N Ivy Ln
- 2771 N Shooting Star St
- 2883 N Shooting Star St
- 2755 N Ivy Ln