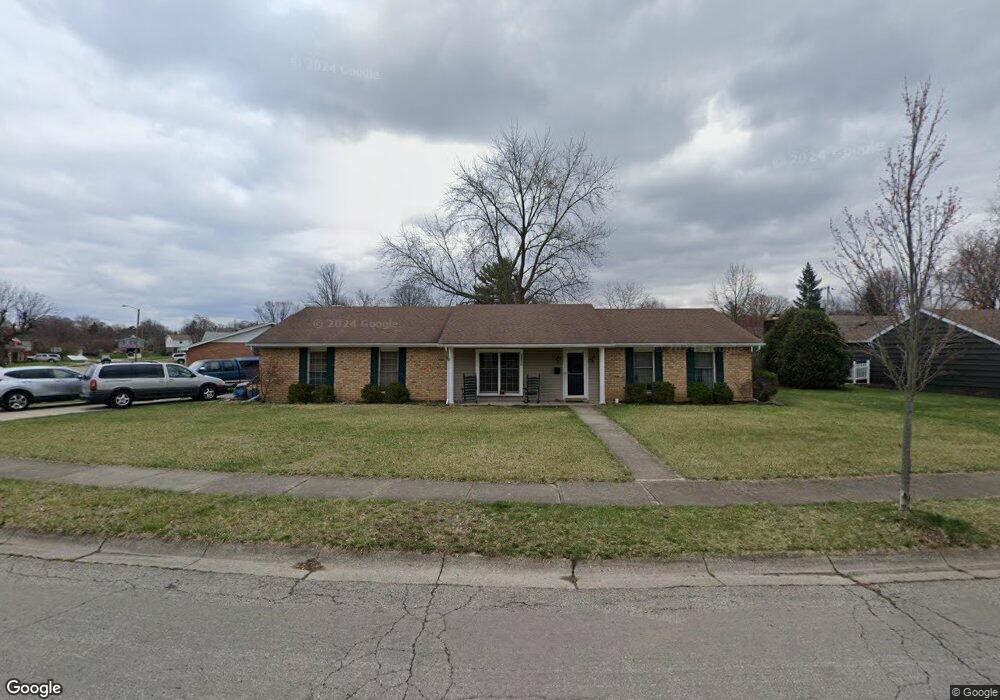
2806 Rensselaer St Springfield, OH 45503
Estimated Value: $226,000 - $250,000
3
Beds
2
Baths
1,484
Sq Ft
$159/Sq Ft
Est. Value
About This Home
This home is located at 2806 Rensselaer St, Springfield, OH 45503 and is currently estimated at $236,040, approximately $159 per square foot. 2806 Rensselaer St is a home located in Clark County with nearby schools including Kenton Elementary School, Roosevelt Middle School, and Springfield High School.
Ownership History
Date
Name
Owned For
Owner Type
Purchase Details
Closed on
Sep 28, 2007
Sold by
Sanders Toby A and Sanders Rachel
Bought by
Gunder Michael K and Gunder Krystle L
Current Estimated Value
Home Financials for this Owner
Home Financials are based on the most recent Mortgage that was taken out on this home.
Original Mortgage
$139,900
Outstanding Balance
$88,888
Interest Rate
6.55%
Mortgage Type
Purchase Money Mortgage
Estimated Equity
$147,152
Purchase Details
Closed on
Jun 23, 2005
Sold by
Eancheff Jane A
Bought by
Sanders Toby A
Home Financials for this Owner
Home Financials are based on the most recent Mortgage that was taken out on this home.
Original Mortgage
$104,000
Interest Rate
5.87%
Mortgage Type
Fannie Mae Freddie Mac
Purchase Details
Closed on
Oct 1, 1998
Sold by
Bayless Russell and Bayless Rebecca
Bought by
Eancheff Jane A and Helen Eileen Gaskill Trust
Purchase Details
Closed on
Jan 18, 1996
Sold by
Eancheff Jane A Trustee
Bought by
Eancheff Jane A
Home Financials for this Owner
Home Financials are based on the most recent Mortgage that was taken out on this home.
Original Mortgage
$68,000
Interest Rate
5.76%
Mortgage Type
Purchase Money Mortgage
Create a Home Valuation Report for This Property
The Home Valuation Report is an in-depth analysis detailing your home's value as well as a comparison with similar homes in the area
Home Values in the Area
Average Home Value in this Area
Purchase History
| Date | Buyer | Sale Price | Title Company |
|---|---|---|---|
| Gunder Michael K | $139,900 | Ohio Real Estate Title | |
| Sanders Toby A | -- | -- | |
| Eancheff Jane A | $127,000 | -- | |
| Eancheff Jane A | -- | -- |
Source: Public Records
Mortgage History
| Date | Status | Borrower | Loan Amount |
|---|---|---|---|
| Open | Gunder Michael K | $139,900 | |
| Closed | Sanders Toby A | $104,000 | |
| Previous Owner | Eancheff Jane A | $68,000 | |
| Closed | Sanders Toby A | $26,000 |
Source: Public Records
Tax History Compared to Growth
Tax History
| Year | Tax Paid | Tax Assessment Tax Assessment Total Assessment is a certain percentage of the fair market value that is determined by local assessors to be the total taxable value of land and additions on the property. | Land | Improvement |
|---|---|---|---|---|
| 2024 | $2,271 | $47,130 | $14,470 | $32,660 |
| 2023 | $2,271 | $47,130 | $14,470 | $32,660 |
| 2022 | $2,327 | $47,130 | $14,470 | $32,660 |
| 2021 | $2,040 | $38,150 | $11,050 | $27,100 |
| 2020 | $2,044 | $38,150 | $11,050 | $27,100 |
| 2019 | $2,049 | $38,150 | $11,050 | $27,100 |
| 2018 | $2,052 | $36,690 | $11,030 | $25,660 |
| 2017 | $2,051 | $41,077 | $11,029 | $30,048 |
| 2016 | $2,053 | $41,077 | $11,029 | $30,048 |
| 2015 | $1,989 | $36,880 | $10,504 | $26,376 |
| 2014 | $1,981 | $36,880 | $10,504 | $26,376 |
| 2013 | $1,959 | $36,880 | $10,504 | $26,376 |
Source: Public Records
Map
Nearby Homes
- 537 Rensselaer St
- 2540 Rebecca Dr
- 2813 Wellsford Dr
- 2516 Balsam Dr
- 2408 Balsam Dr
- 2933 Stonehaven Dr
- 2524 Home Orchard Dr
- 732 Grandview Dr Unit 732
- 2683 Home Orchard Dr
- 2933 Bahia Dr
- 2642 Kilkenny Ct
- 115 E Home Rd
- 0 E Home Rd
- 647 Villa Rd Unit A
- 542 Villa Rd
- 2541 Derr Rd
- 1225 Vester Ave
- 2215 N Fountain Blvd
- 2738 Rensselaer St
- 519 Rensselaer St
- 535 Rensselaer St
- 2728 Rensselaer St
- 528 Rebecca Dr
- 2807 Rensselaer St
- 534 Rebecca Dr
- 2739 Rensselaer St
- 2825 Rensselaer St
- 520 Rensselaer St
- 520 Rebecca Dr
- 538 Rebecca Dr
- 516 Rensselaer St
- 530 Rensselaer St
- 2731 Rensselaer St
- 536 Rensselaer St
- 542 Rebecca Dr
- 2723 Rensselaer St
- 541 Rensselaer St
- 529 Rebecca Dr