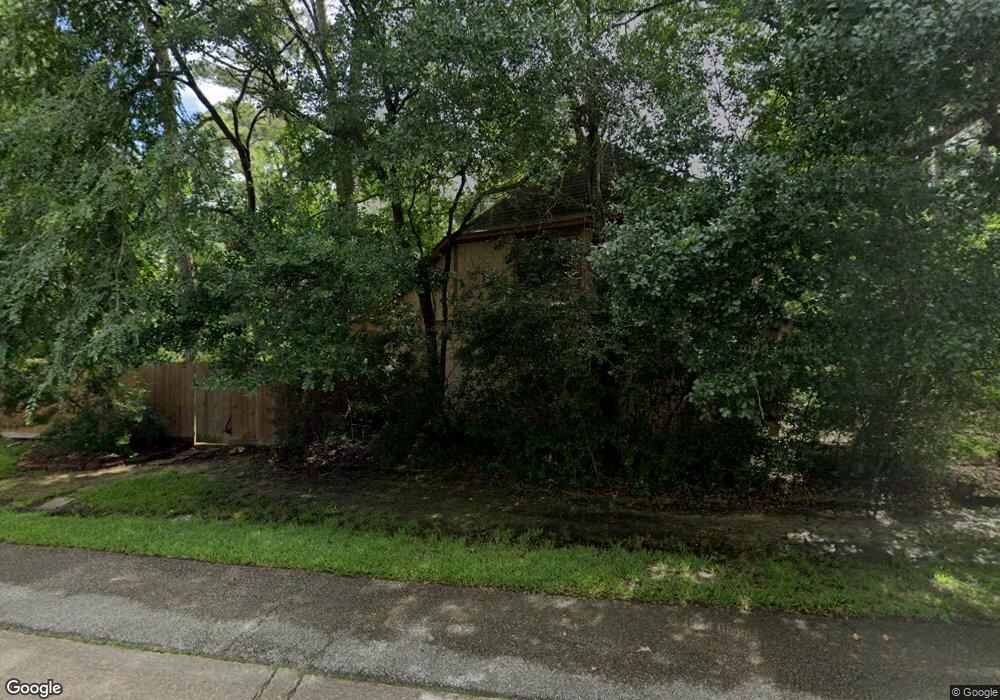
2806 S Logrun Cir Spring, TX 77380
Grogan's Mill NeighborhoodEstimated Value: $692,390 - $795,000
About This Home
This home is located at 2806 S Logrun Cir, Spring, TX 77380 and is currently estimated at $738,098, approximately $235 per square foot. 2806 S Logrun Cir is a home located in Montgomery County with nearby schools including Hailey Elementary School, W.D Wilkerson Intermediate School, and Knox J High School.
Ownership History
We collect this data history from publicly available records. To have your information removed, we recommend requesting removal directly through your county’s website.
Purchase Details
Home Financials for this Owner
Home Financials are based on the most recent Mortgage that was taken out on this home.Purchase Details
Purchase Details
Home Financials for this Owner
Home Financials are based on the most recent Mortgage that was taken out on this home.Purchase Details
Home Values in the Area
Average Home Value in this Area
Purchase History
We collect this data history from publicly available records. To have your information removed, we recommend requesting removal directly through your county’s website.
| Date | Buyer | Sale Price | Title Company |
|---|---|---|---|
| -- | Chicago Title | ||
| -- | -- | ||
| -- | -- | ||
| -- | -- |
Mortgage History
We collect this data history from publicly available records. To have your information removed, we recommend requesting removal directly through your county’s website.
| Date | Status | Borrower | Loan Amount |
|---|---|---|---|
| Open | $134,900 | ||
| Previous Owner | $114,000 |
Tax History
We collect this data history from publicly available records. To have your information removed, we recommend requesting removal directly through your county’s website.
| Year | Tax Paid | Tax Assessment Tax Assessment Total Assessment is a certain percentage of the fair market value that is determined by local assessors to be the total taxable value of land and additions on the property. | Land | Improvement |
|---|---|---|---|---|
| 2025 | $3,260 | $390,564 | -- | -- |
| 2024 | $3,225 | $355,058 | -- | -- |
| 2023 | $3,225 | $322,780 | $70,000 | $275,280 |
| 2022 | $5,602 | $293,440 | $70,000 | $275,280 |
| 2021 | $5,460 | $266,760 | $21,240 | $245,520 |
| 2020 | $5,879 | $273,680 | $21,240 | $252,440 |
| 2019 | $6,264 | $283,220 | $21,240 | $261,980 |
| 2018 | $5,601 | $283,220 | $21,240 | $261,980 |
| 2017 | $5,928 | $263,930 | $21,240 | $242,690 |
| 2016 | $6,179 | $275,100 | $19,120 | $255,980 |
| 2015 | $5,604 | $263,240 | $19,120 | $244,120 |
| 2014 | $5,604 | $256,600 | $19,120 | $255,980 |
Map
- 2824 S Logrun Cir
- 10909 Sweetspire Place
- 2701 Crossvine Cir
- 50 Lazy Ln
- 10816 Colony Wood Place
- 26240 McDonald Rd
- 26442 McDonald Rd
- 42 Secluded Trail
- 54 Secluded Trail
- 18 Secluded Trail
- 22 Lakeside Cove
- 10717 N Autumnwood Way
- 3203 Willie Way
- 25737 Glen Loch Dr
- 4 N Autumnwood Way
- 3018 McDonald Ct
- 3306 Gary Ln
- 46 N Autumnwood Way
- 3302 Willie Way
- 140 S Timber Top Dr
- 2808 S Logrun Cir
- 2804 S Logrun Cir
- 2725 N Logrun Cir
- 2812 S Logrun Cir
- 2814 S Logrun Cir
- 2810 S Logrun Cir
- 2721 N Logrun Cir
- 2816 S Logrun Cir
- 2809 S Logrun Cir
- 2807 S Logrun Cir
- 2813 S Logrun Cir
- 2717 N Logrun Cir
- 2822 S Logrun Cir
- 2805 S Logrun Cir
- 2719 N Logrun Cir
- 2820 S Logrun Cir
- 2815 S Logrun Cir
- Lot 30 and 31 Glen
- 2715 N Logrun Cir
- 2724 N Logrun Cir
Ask me questions while you tour the home.