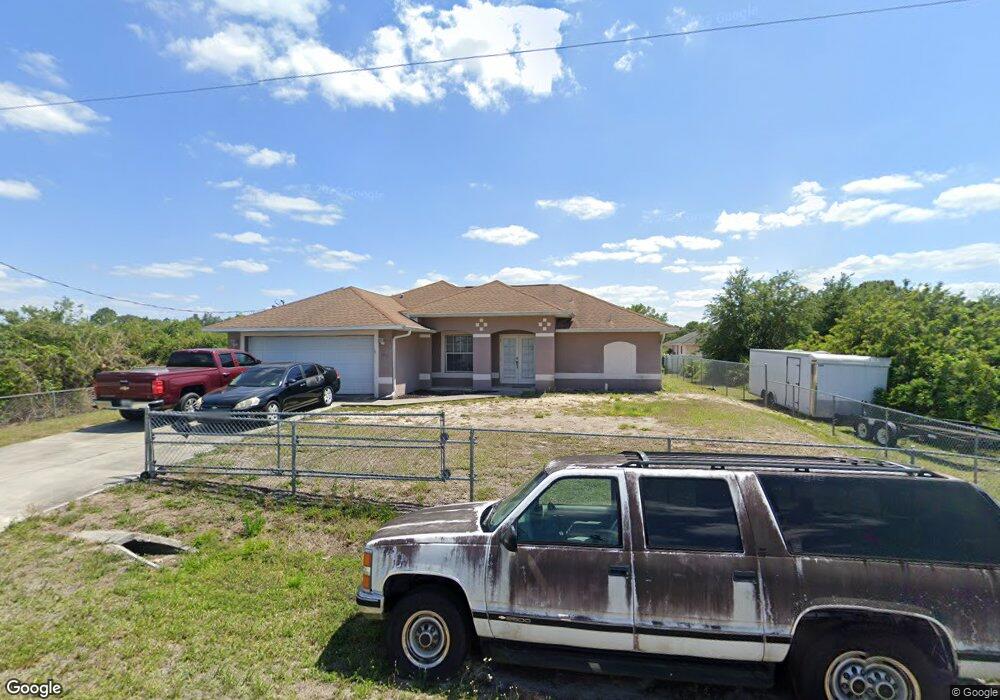
2807 54th St W Unit 7 Lehigh Acres, FL 33971
Harris NeighborhoodEstimated Value: $294,000 - $339,000
4
Beds
2
Baths
1,838
Sq Ft
$170/Sq Ft
Est. Value
About This Home
This home is located at 2807 54th St W Unit 7, Lehigh Acres, FL 33971 and is currently estimated at $312,600, approximately $170 per square foot. 2807 54th St W Unit 7 is a home located in Lee County with nearby schools including Lehigh Elementary School, The Alva School, and Orange River Elementary School.
Ownership History
Date
Name
Owned For
Owner Type
Purchase Details
Closed on
Nov 1, 2018
Sold by
Mallary Lorian and Mallary Jeannette T
Bought by
Mallary Dorian Demetric and Mallary Dorneisha Denise
Current Estimated Value
Purchase Details
Closed on
Jul 22, 2011
Sold by
Mcaffee Larry and Mcaffee Whitney
Bought by
Mallary Lorian and Mallary Jeannette T
Purchase Details
Closed on
May 11, 2009
Sold by
Fdic
Bought by
Mcaffee Larry and Mcaffee Whitney
Purchase Details
Closed on
Jul 12, 2007
Sold by
Allweiss Barry
Bought by
Riverside Bank Of The Gulf Coast
Purchase Details
Closed on
Nov 14, 2005
Sold by
Scarbrough John R and Scarbrough Karen J
Bought by
Allweiss Barry
Home Financials for this Owner
Home Financials are based on the most recent Mortgage that was taken out on this home.
Original Mortgage
$196,176
Interest Rate
6.04%
Mortgage Type
Construction
Create a Home Valuation Report for This Property
The Home Valuation Report is an in-depth analysis detailing your home's value as well as a comparison with similar homes in the area
Home Values in the Area
Average Home Value in this Area
Purchase History
| Date | Buyer | Sale Price | Title Company |
|---|---|---|---|
| Mallary Dorian Demetric | -- | Attorney | |
| Mallary Lorian | $55,000 | Townsend Title Insurance Age | |
| Mcaffee Larry | $70,000 | Sunbelt Title Agency | |
| Riverside Bank Of The Gulf Coast | $88,200 | Attorney | |
| Allweiss Barry | $55,000 | Lee Harbor Title Llp | |
| Scarbrough John R | $50,000 | Lee Harbor Title Lllp |
Source: Public Records
Mortgage History
| Date | Status | Borrower | Loan Amount |
|---|---|---|---|
| Previous Owner | Allweiss Barry | $196,176 |
Source: Public Records
Tax History Compared to Growth
Tax History
| Year | Tax Paid | Tax Assessment Tax Assessment Total Assessment is a certain percentage of the fair market value that is determined by local assessors to be the total taxable value of land and additions on the property. | Land | Improvement |
|---|---|---|---|---|
| 2025 | $2,285 | $163,886 | -- | -- |
| 2024 | $2,160 | $159,267 | -- | -- |
| 2023 | $2,160 | $154,628 | $0 | $0 |
| 2022 | $2,021 | $150,124 | $0 | $0 |
| 2021 | $1,945 | $157,138 | $7,795 | $149,343 |
| 2020 | $1,947 | $143,739 | $0 | $0 |
| 2019 | $1,955 | $140,507 | $3,800 | $136,707 |
| 2018 | $2,220 | $142,117 | $4,500 | $137,617 |
| 2017 | $2,047 | $124,347 | $3,960 | $120,387 |
| 2016 | $1,892 | $109,330 | $6,887 | $102,443 |
| 2015 | $1,724 | $93,110 | $5,212 | $87,898 |
| 2014 | $1,525 | $81,795 | $4,960 | $76,835 |
| 2013 | -- | $69,601 | $4,247 | $65,354 |
Source: Public Records
Map
Nearby Homes
- 2806 54th St W
- 2809 54th St W
- 3401 June Ave N
- 6008 June Ave N
- 2714 53rd St W Unit 18
- 2813 52nd St W
- 2706 55th St W
- 2813 57th St W
- 2716 52nd St W
- 2617 54th St W
- 2904 50th W
- 2918 52nd St W
- 2821 50th St W
- 3000 52nd St W
- 2709 58th St W
- 2713 51st St W
- 2712 58th St W
- 2620 57th St W
- 2609 53rd St W
- 3007 53rd St W
- 2803 54th St W Unit 7
- 2804 54th St W
- 2808 53rd St W Unit 7
- 2802 53rd St W
- 2801 54th St W
- 6008 June Ave N Unit 4
- 7502 June Ave N Unit 2
- 7500 June Ave N Unit 1
- 4601 June Ave N
- 4606 June Ave N
- 4625 June Ave N
- 3402 June Ave N
- 2812 53rd St W
- 2812 53rd St W
- 2800 54th St SW
- 2800 54th St W
- 2803 53rd St W
- 2803 55th St W
- 2809 53rd St W
- 2811 55th St W