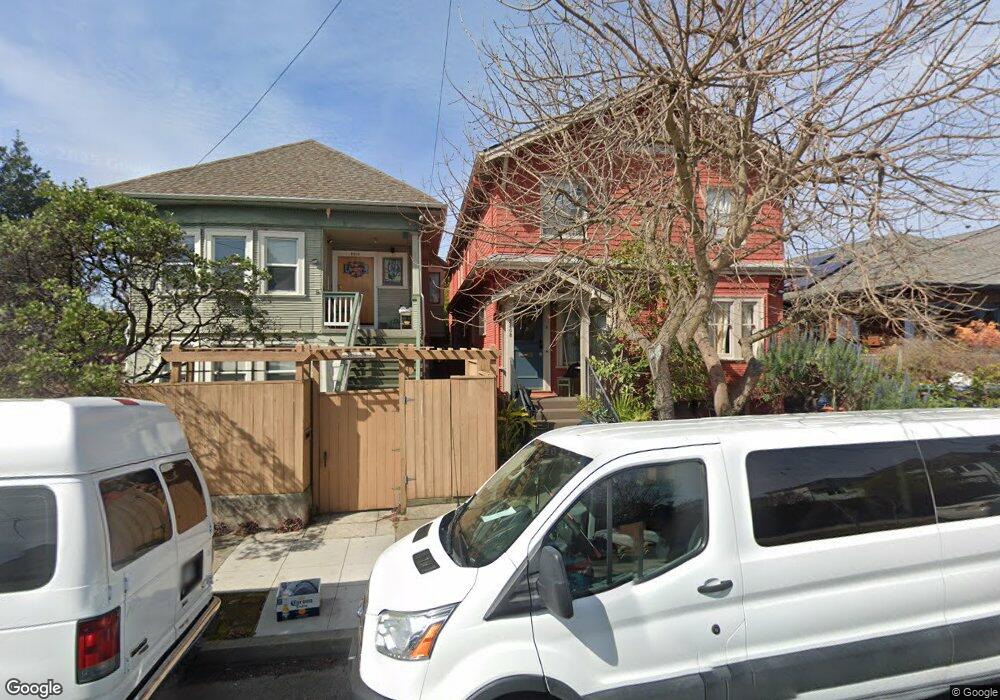
2808 Grant St Berkeley, CA 94703
South Berkeley NeighborhoodEstimated Value: $758,000 - $1,596,000
7
Beds
5
Baths
2,393
Sq Ft
$561/Sq Ft
Est. Value
About This Home
This home is located at 2808 Grant St, Berkeley, CA 94703 and is currently estimated at $1,342,739, approximately $561 per square foot. 2808 Grant St is a home located in Alameda County with nearby schools including Malcolm X Elementary School, Emerson Elementary School, and John Muir Elementary School.
Ownership History
Date
Name
Owned For
Owner Type
Purchase Details
Closed on
Sep 8, 2008
Sold by
Newcomb Randy H and Newcomb Wioleta
Bought by
Leeds Michael and Leeds Kiren
Current Estimated Value
Home Financials for this Owner
Home Financials are based on the most recent Mortgage that was taken out on this home.
Original Mortgage
$520,000
Outstanding Balance
$345,707
Interest Rate
6.51%
Mortgage Type
Purchase Money Mortgage
Estimated Equity
$997,032
Purchase Details
Closed on
Dec 3, 2004
Sold by
Newcomb Randy H
Bought by
Newcomb Randy H and Newcomb Wioleta
Home Financials for this Owner
Home Financials are based on the most recent Mortgage that was taken out on this home.
Original Mortgage
$435,000
Interest Rate
5.74%
Mortgage Type
Stand Alone First
Purchase Details
Closed on
Dec 5, 2003
Sold by
Huckaby Charles Robert
Bought by
Huckaby Charles Robert and Rasmussen Terrill Ann
Create a Home Valuation Report for This Property
The Home Valuation Report is an in-depth analysis detailing your home's value as well as a comparison with similar homes in the area
Home Values in the Area
Average Home Value in this Area
Purchase History
| Date | Buyer | Sale Price | Title Company |
|---|---|---|---|
| Leeds Michael | $650,000 | Chicago Title Company | |
| Newcomb Randy H | -- | Placer Title Company | |
| Newcomb Randy H | $795,000 | Placer Title Company | |
| Huckaby Charles Robert | -- | -- |
Source: Public Records
Mortgage History
| Date | Status | Borrower | Loan Amount |
|---|---|---|---|
| Open | Leeds Michael | $520,000 | |
| Previous Owner | Newcomb Randy H | $435,000 | |
| Closed | Newcomb Randy H | $160,000 |
Source: Public Records
Tax History
| Year | Tax Paid | Tax Assessment Tax Assessment Total Assessment is a certain percentage of the fair market value that is determined by local assessors to be the total taxable value of land and additions on the property. | Land | Improvement |
|---|---|---|---|---|
| 2025 | $15,537 | $836,984 | $251,095 | $585,889 |
| 2024 | $15,537 | $820,578 | $246,173 | $574,405 |
| 2023 | $15,189 | $804,491 | $241,347 | $563,144 |
| 2022 | $14,852 | $788,722 | $236,616 | $552,106 |
| 2021 | $14,846 | $773,258 | $231,977 | $541,281 |
| 2020 | $13,871 | $765,335 | $229,600 | $535,735 |
| 2019 | $13,133 | $750,333 | $225,100 | $525,233 |
| 2018 | $12,877 | $735,624 | $220,687 | $514,937 |
| 2017 | $12,421 | $721,200 | $216,360 | $504,840 |
| 2016 | $11,903 | $707,063 | $212,119 | $494,944 |
| 2015 | $11,729 | $696,448 | $208,934 | $487,514 |
| 2014 | $11,778 | $682,811 | $204,843 | $477,968 |
Source: Public Records
Map
Nearby Homes
- 2701 Grant St
- 2926 Ellis St
- 1646 Ashby Ave
- 1530 Stuart St
- 1901 Parker St Unit 3
- 1612 Carleton St
- 1535 Julia St
- 2057 Emerson St
- 1612 Parker St
- 1515 Derby St
- 2110 Ashby Ave
- 2790 Sacramento St
- 2782 Sacramento St
- 2750 Sacramento St
- 2774 Sacramento St
- 2758 Sacramento St
- 1450 Ward St
- 2018 Blake St
- 1645 Dwight Way
- 2923 Wheeler St
- 2810 Grant St
- 2806 Grant St
- 2804 Grant St
- 1738 Stuart St
- 1736 Stuart St Unit C
- 1736 Stuart St
- 2800 Grant St Unit B
- 2800 Grant St Unit A
- 1743 Oregon St
- 2802 Grant St
- 1747 Oregon St
- 1741 Oregon St
- 1731 Oregon St
- 1729 Oregon St
- 1800 Stuart St
- 1730 Stuart St Unit A
- 2811 Grant St
- 1727 Oregon St Unit D
- 1727 Oregon St Unit A
- 1727 Oregon St Unit C
Your Personal Tour Guide
Ask me questions while you tour the home.