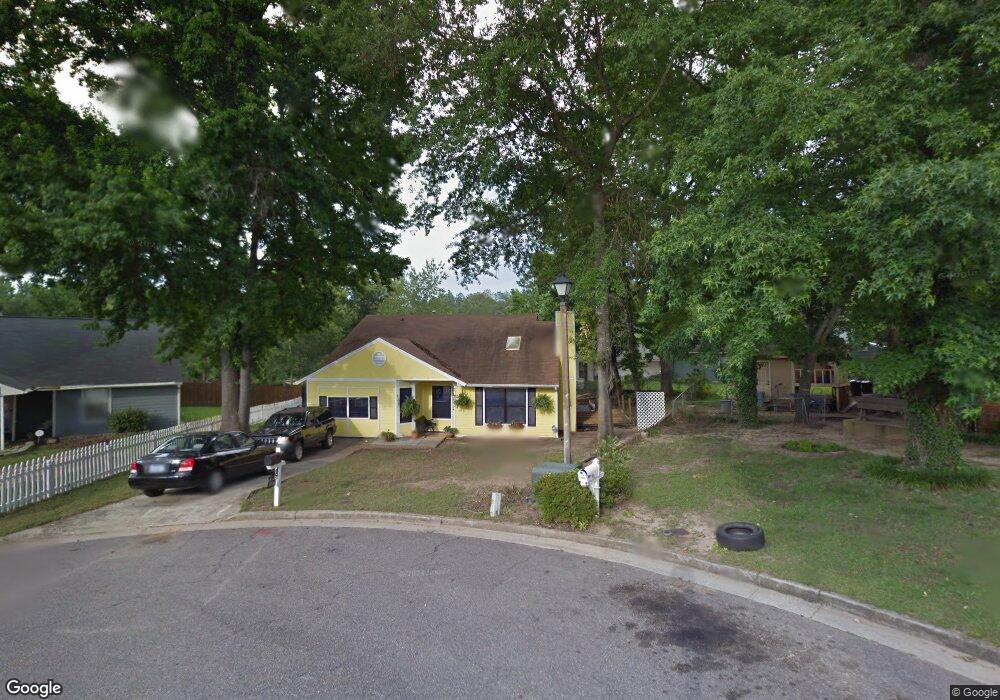
2808 Ridgecrest Dr Hephzibah, GA 30815
Windsor Spring NeighborhoodEstimated Value: $145,269 - $177,000
3
Beds
2
Baths
1,481
Sq Ft
$113/Sq Ft
Est. Value
About This Home
This home is located at 2808 Ridgecrest Dr, Hephzibah, GA 30815 and is currently estimated at $167,567, approximately $113 per square foot. 2808 Ridgecrest Dr is a home located in Richmond County with nearby schools including Jamestown Elementary School, Glenn Hills Middle School, and Johnson Magnet.
Ownership History
Date
Name
Owned For
Owner Type
Purchase Details
Closed on
Apr 26, 1994
Sold by
Housing & Urban Development Secretary Of
Bought by
Fuller Josephine
Current Estimated Value
Purchase Details
Closed on
Dec 31, 1993
Sold by
Housing & Urban Dev
Bought by
Fuller Josephine
Purchase Details
Closed on
Oct 6, 1992
Sold by
First Union Mortgag
Bought by
Housing & Urban Dev
Purchase Details
Closed on
Apr 11, 1991
Sold by
First Union National Bank
Bought by
Mccroan Sheryl E
Purchase Details
Closed on
Apr 5, 1990
Sold by
Mccroan Sheryl E
Bought by
Gilbert Jessie Gilbert Earlene E
Purchase Details
Closed on
Apr 2, 1990
Sold by
Mccroan Sheryl E
Bought by
Gilbert Jessie
Purchase Details
Closed on
Jul 1, 1985
Sold by
First Union Nationa
Bought by
Mccroan Sheryl E
Create a Home Valuation Report for This Property
The Home Valuation Report is an in-depth analysis detailing your home's value as well as a comparison with similar homes in the area
Home Values in the Area
Average Home Value in this Area
Purchase History
| Date | Buyer | Sale Price | Title Company |
|---|---|---|---|
| Fuller Josephine | -- | -- | |
| Fuller Josephine | $48,500 | -- | |
| Housing & Urban Dev | $67,900 | -- | |
| Mccroan Sheryl E | -- | -- | |
| Gilbert Jessie Gilbert Earlene E | $1,500 | -- | |
| Gilbert Jessie | $59,900 | -- | |
| Mccroan Sheryl E | $54,000 | -- |
Source: Public Records
Tax History Compared to Growth
Tax History
| Year | Tax Paid | Tax Assessment Tax Assessment Total Assessment is a certain percentage of the fair market value that is determined by local assessors to be the total taxable value of land and additions on the property. | Land | Improvement |
|---|---|---|---|---|
| 2025 | $879 | $55,392 | $5,320 | $50,072 |
| 2024 | $879 | $53,868 | $5,320 | $48,548 |
| 2023 | $565 | $50,736 | $5,320 | $45,416 |
| 2022 | $673 | $39,286 | $5,320 | $33,966 |
| 2021 | $612 | $30,322 | $5,320 | $25,002 |
| 2020 | $615 | $30,322 | $5,320 | $25,002 |
| 2019 | $636 | $30,322 | $5,320 | $25,002 |
| 2018 | $1,144 | $30,322 | $5,320 | $25,002 |
| 2017 | $1,083 | $30,322 | $5,320 | $25,002 |
| 2016 | $1,084 | $30,322 | $5,320 | $25,002 |
| 2015 | $1,091 | $30,322 | $5,320 | $25,002 |
| 2014 | $1,134 | $30,322 | $5,320 | $25,002 |
Source: Public Records
Map
Nearby Homes
- 4004 Rambling Way
- 3603 Pebble Creek Dr
- 4105 Darsey Ct
- 3602 Pebble Creek Dr
- 3625 Pebble Creek Dr
- 3621 Pebble Creek Dr
- 3623 Pebble Creek Dr
- 3629 Pebble Creek Dr
- 3627 Pebble Creek Dr
- 2813 Ridgecrest Dr
- 2703 Crestview Ct
- 3332 Saddle Brook Dr
- 3507 Mercedes Dr
- 3512 Morgan Rd
- 2924 Algernon Cir
- 3516 Windermere Dr
- 3503 Edgeworth Dr
- 3503 Windermere Dr
- 2746 Crosshaven Dr
- 2810 Ridgecrest Dr
- 3509 Pebble Creek Dr
- 3507 Pebble Creek Dr
- 3511 Pebble Creek Dr
- 2806 Ridgecrest Dr
- 2819 Ridgecrest Dr
- 4012 Rambling Way
- 4012 Rambling Way Unit 37
- 4012 Rambling Rose Cir N
- 4010 Rambling Way
- 4010 Rambling Way
- 4010 Rambling Way Unit 38
- 4010 Rambling Rose Cir N
- 3513 Pebble Creek Dr
- 4168 Pebble Creek Dr
- 3546 Pebble Creek Dr
- 3541 Pebble Creek Dr
- 3544 Pebble Creek Dr
- 3619 Pebble Creek Dr
- 3617 Pebble Creek Dr