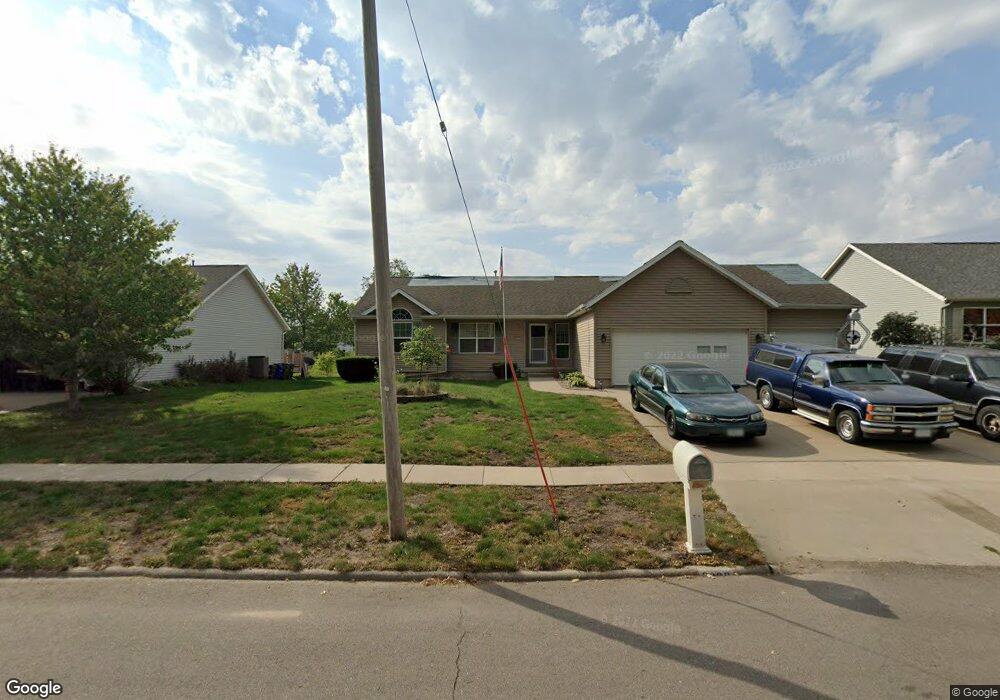
2809 28th Ave SW Cedar Rapids, IA 52404
Estimated Value: $320,000 - $373,428
4
Beds
4
Baths
1,720
Sq Ft
$202/Sq Ft
Est. Value
About This Home
This home is located at 2809 28th Ave SW, Cedar Rapids, IA 52404 and is currently estimated at $346,607, approximately $201 per square foot. 2809 28th Ave SW is a home located in Linn County with nearby schools including Junction City Elementary School, Perryville Elementary School, and Van Buren Elementary School.
Ownership History
Date
Name
Owned For
Owner Type
Purchase Details
Closed on
May 22, 2007
Sold by
Emc Mortgage Corp
Bought by
Rairdin James and Schmitt Rairdin Susan J
Current Estimated Value
Home Financials for this Owner
Home Financials are based on the most recent Mortgage that was taken out on this home.
Original Mortgage
$224,062
Outstanding Balance
$136,587
Interest Rate
6.21%
Mortgage Type
VA
Estimated Equity
$210,020
Purchase Details
Closed on
Jan 29, 2007
Sold by
Arbuckle Lisa A and Arbuckle Ronald M
Bought by
Emc Mortgage
Purchase Details
Closed on
Aug 22, 2001
Sold by
Midwest Development Co
Bought by
Arbuckle Ronald M and Arbuckle Lisa A
Home Financials for this Owner
Home Financials are based on the most recent Mortgage that was taken out on this home.
Original Mortgage
$222,210
Interest Rate
9.87%
Create a Home Valuation Report for This Property
The Home Valuation Report is an in-depth analysis detailing your home's value as well as a comparison with similar homes in the area
Home Values in the Area
Average Home Value in this Area
Purchase History
| Date | Buyer | Sale Price | Title Company |
|---|---|---|---|
| Rairdin James | $219,500 | None Available | |
| Emc Mortgage | $278,085 | None Available | |
| Arbuckle Ronald M | $233,500 | -- |
Source: Public Records
Mortgage History
| Date | Status | Borrower | Loan Amount |
|---|---|---|---|
| Open | Rairdin James | $224,062 | |
| Previous Owner | Arbuckle Ronald M | $222,210 |
Source: Public Records
Tax History Compared to Growth
Tax History
| Year | Tax Paid | Tax Assessment Tax Assessment Total Assessment is a certain percentage of the fair market value that is determined by local assessors to be the total taxable value of land and additions on the property. | Land | Improvement |
|---|---|---|---|---|
| 2025 | $5,620 | $304,500 | $53,800 | $250,700 |
| 2024 | $6,162 | $294,100 | $45,500 | $248,600 |
| 2023 | $6,162 | $335,000 | $43,500 | $291,500 |
| 2022 | $5,740 | $301,000 | $43,500 | $257,500 |
| 2021 | $6,128 | $286,000 | $39,300 | $246,700 |
| 2020 | $6,128 | $286,300 | $33,100 | $253,200 |
| 2019 | $5,470 | $262,300 | $33,100 | $229,200 |
| 2018 | $5,314 | $262,300 | $33,100 | $229,200 |
| 2017 | $5,068 | $241,200 | $33,100 | $208,100 |
| 2016 | $5,127 | $241,200 | $33,100 | $208,100 |
| 2015 | $5,241 | $246,316 | $33,120 | $213,196 |
| 2014 | $5,056 | $246,316 | $33,120 | $213,196 |
| 2013 | $4,872 | $246,316 | $33,120 | $213,196 |
Source: Public Records
Map
Nearby Homes
- 2812 29th Ave SW
- 3009 Carriage Dr SW
- 3108 Huxley Ln SW
- 3139 Stratford Ln SW
- 3221 Bramble Rd SW
- 3132 Pebble Dr SW
- 2521 Radcliffe Ct SW
- 3205 33rd Ave SW
- 3302 Sokol Ln SW
- 3000 Wilson Ave SW Unit A11
- 3000 Wilson Ave SW
- 3405 Queen Dr SW
- 3315 Sokol Ln SW
- 3321 Sokol Ln SW
- 3406 Sokol Ln SW
- 3212 Wilson Ave SW
- 3424 Sokol Ln SW
- 3502 Sokol Ln SW
- 3508 Sokol Ln SW
- 3431 Sokol Ln SW
- 2803 28th Ave SW
- 2719 28th Ave SW
- 2713 28th Ave SW
- 2800 29th Ave SW
- 2732 29th Ave SW
- 2810 28th Ave SW
- 2804 28th Ave SW
- 2806 29th Ave SW
- 2905 28th Ave SW
- 2726 29th Ave SW
- 2724 28th Ave SW
- 2725 29th St SW
- 2720 29th Ave SW
- 2707 28th Ave SW
- 2718 28th Ave SW
- 2911 28th Ave SW
- 2818 29th Ave SW
- 2714 29th Ave SW
- 2701 28th Ave SW
- 2824 29th Ave SW