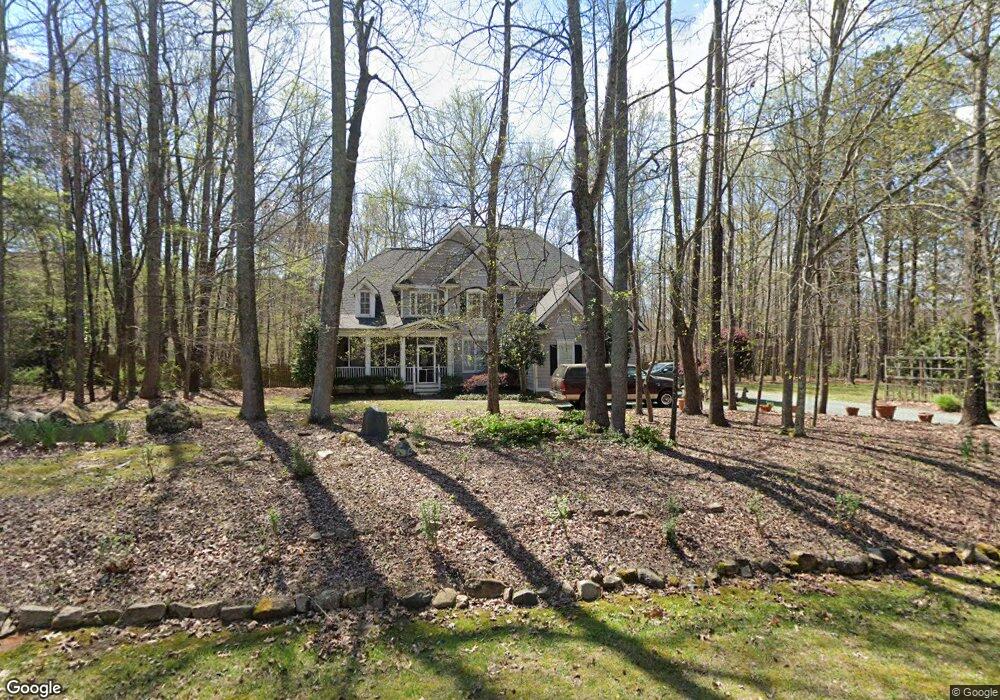
281 Amber Wood Run Chapel Hill, NC 27516
Estimated Value: $754,520 - $874,000
4
Beds
4
Baths
2,765
Sq Ft
$294/Sq Ft
Est. Value
About This Home
This home is located at 281 Amber Wood Run, Chapel Hill, NC 27516 and is currently estimated at $812,880, approximately $293 per square foot. 281 Amber Wood Run is a home located in Chatham County with nearby schools including Margaret B. Pollard Middle School and Holy Youth Christian Academy.
Ownership History
Date
Name
Owned For
Owner Type
Purchase Details
Closed on
Jan 16, 2024
Sold by
Kemling Charles William and Kemling Susan Earle
Bought by
Kemling Charles William and Kemling Susan Earle
Current Estimated Value
Purchase Details
Closed on
Jun 14, 2019
Sold by
Wells Aaron Craig and Wells Terra Leigh
Bought by
Kemling Charles William
Purchase Details
Closed on
Oct 26, 2014
Sold by
Meffe David J and Meffe Jennifer M
Bought by
Wells Aaron Craig and Wells Terra Leigh
Home Financials for this Owner
Home Financials are based on the most recent Mortgage that was taken out on this home.
Original Mortgage
$340,000
Interest Rate
4.09%
Mortgage Type
New Conventional
Purchase Details
Closed on
Sep 27, 2005
Sold by
Hunter Fred E and Baze Darlene
Bought by
Meffe David J and Meffe Jennifer M
Home Financials for this Owner
Home Financials are based on the most recent Mortgage that was taken out on this home.
Original Mortgage
$250,000
Interest Rate
5.77%
Mortgage Type
New Conventional
Create a Home Valuation Report for This Property
The Home Valuation Report is an in-depth analysis detailing your home's value as well as a comparison with similar homes in the area
Home Values in the Area
Average Home Value in this Area
Purchase History
| Date | Buyer | Sale Price | Title Company |
|---|---|---|---|
| Kemling Charles William | -- | None Listed On Document | |
| Kemling Charles William | $485,000 | None Available | |
| Wells Aaron Craig | $400,000 | None Available | |
| Meffe David J | $415,000 | None Available |
Source: Public Records
Mortgage History
| Date | Status | Borrower | Loan Amount |
|---|---|---|---|
| Previous Owner | Wells Aaron Craig | $340,000 | |
| Previous Owner | Meffe David J | $250,000 |
Source: Public Records
Tax History Compared to Growth
Tax History
| Year | Tax Paid | Tax Assessment Tax Assessment Total Assessment is a certain percentage of the fair market value that is determined by local assessors to be the total taxable value of land and additions on the property. | Land | Improvement |
|---|---|---|---|---|
| 2025 | $5,150 | $711,311 | $116,500 | $594,811 |
| 2024 | $5,150 | $472,514 | $106,000 | $366,514 |
| 2023 | $3,842 | $472,514 | $106,000 | $366,514 |
| 2022 | $3,825 | $472,514 | $106,000 | $366,514 |
| 2021 | $3,778 | $472,514 | $106,000 | $366,514 |
| 2020 | $3,530 | $437,703 | $90,312 | $347,391 |
| 2019 | $3,530 | $437,703 | $90,312 | $347,391 |
| 2018 | $3,325 | $437,703 | $90,312 | $347,391 |
| 2017 | $3,291 | $437,703 | $90,312 | $347,391 |
| 2016 | $3,572 | $472,442 | $90,312 | $382,130 |
| 2015 | $3,516 | $472,442 | $90,312 | $382,130 |
| 2014 | -- | $472,442 | $90,312 | $382,130 |
| 2013 | -- | $472,442 | $90,312 | $382,130 |
Source: Public Records
Map
Nearby Homes
- 594 Cedar Lake Rd Unit A & B
- 403 Brandywine Rd
- 348 Cedar Lake Rd Unit A & B
- 3537 Lodge Trail
- 82 Margaret Daniel Ln
- 1705 Smith Level Rd Unit A
- 708 October Woods Rd
- 103 Stonehill Rd
- 204 Twisted Oak Way
- Nora II Plan at Chapel Oaks
- Stoneridge Plan at Chapel Oaks
- Hampshire Plan at Chapel Oaks
- Kendrick Plan at Chapel Oaks
- Rosella Plan at Chapel Oaks
- Dunmore Plan at Chapel Oaks
- Halstead Plan at Chapel Oaks
- 2306 Damascus Church Rd
- 51 Araya Ln
- 23 Bonterra Way
- 1117 Old Lystra Rd
- 6 Stony Branch Trail
- 250 Amber Wood Run Unit a
- 193 Amber Wood Run
- Lot 17 Stony Branch Trail
- Lot 18 Stony Branch Trail
- Lot 16 Stony Branch Trail
- 27 Stony Branch Trail
- 0 Stoney Branch Trail Unit 987357
- 0 Stoney Branch Trail Unit 16 TR987357
- 225 Stony Branch Trail
- 194 Amber Wood Run
- 220 Amber Wood Run
- 191 Amber Wood Run
- 9 Stony Branch Trail
- 250 Stony Branch Trail
- 502 Marvin Edwards Ln
- 245 Stony Branch Trail
- 173 Amber Wood Run
- 500 Marvin Edwards Ln
- 80 Amber Wood Run