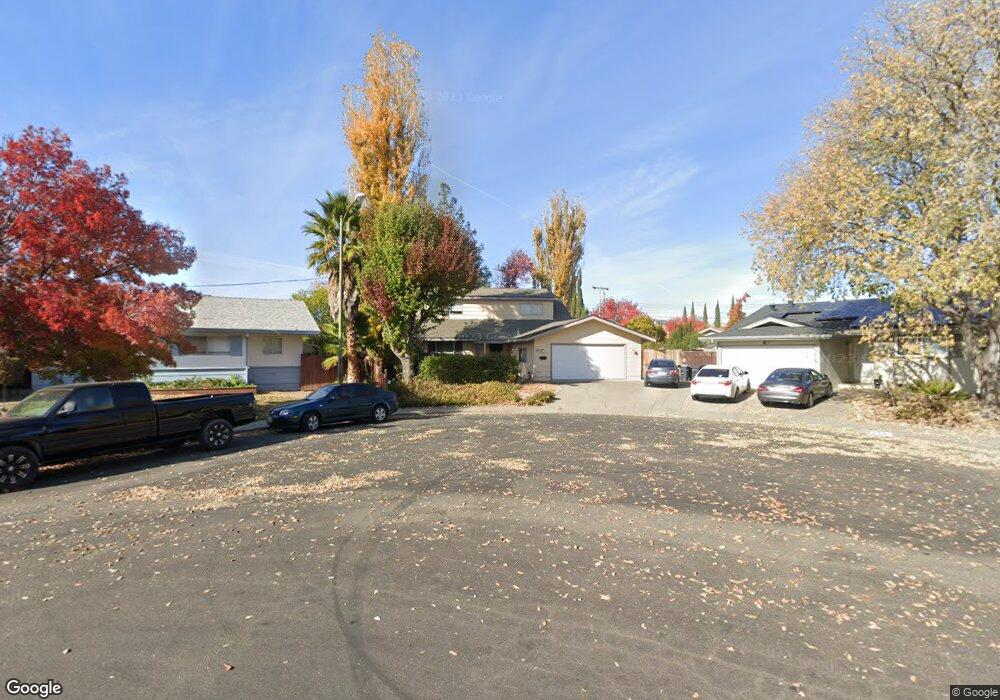
281 Camellia St Fairfield, CA 94533
Estimated Value: $492,000 - $549,000
4
Beds
2
Baths
1,961
Sq Ft
$266/Sq Ft
Est. Value
About This Home
This home is located at 281 Camellia St, Fairfield, CA 94533 and is currently estimated at $521,628, approximately $266 per square foot. 281 Camellia St is a home located in Solano County with nearby schools including Dover Elementary School, Grange Middle School, and Fairfield High School.
Ownership History
Date
Name
Owned For
Owner Type
Purchase Details
Closed on
Aug 23, 2017
Sold by
Thpi Acquisition Holdings Llc
Bought by
Tah 2017-1 Borrower Llc
Current Estimated Value
Purchase Details
Closed on
Jun 17, 2013
Sold by
Thpi Acquisition Holdings Llc
Bought by
Thpi Acquisition Holdings Llc
Purchase Details
Closed on
May 23, 2012
Sold by
Fannie Mae
Bought by
Thpi Acquisition Holdings Llc
Purchase Details
Closed on
Dec 7, 2011
Sold by
Mcbride Brian C and Mcbride Kimberly G
Bought by
Fannie Mae
Purchase Details
Closed on
May 26, 1994
Sold by
Mcbride Brian C and Mcbride Kimberley G
Bought by
Mcbride Brian C and Mcbride Kimberly G
Home Financials for this Owner
Home Financials are based on the most recent Mortgage that was taken out on this home.
Original Mortgage
$132,000
Interest Rate
8.53%
Create a Home Valuation Report for This Property
The Home Valuation Report is an in-depth analysis detailing your home's value as well as a comparison with similar homes in the area
Home Values in the Area
Average Home Value in this Area
Purchase History
| Date | Buyer | Sale Price | Title Company |
|---|---|---|---|
| Tah 2017-1 Borrower Llc | -- | None Available | |
| Thpi Acquisition Holdings Llc | -- | Old Republic Title Company | |
| Thpi Acquisition Holdings Llc | $150,000 | Old Republic Title Company | |
| Fannie Mae | $132,900 | Accommodation | |
| Mcbride Brian C | -- | Placer Title Company |
Source: Public Records
Mortgage History
| Date | Status | Borrower | Loan Amount |
|---|---|---|---|
| Previous Owner | Mcbride Brian C | $132,000 |
Source: Public Records
Tax History Compared to Growth
Tax History
| Year | Tax Paid | Tax Assessment Tax Assessment Total Assessment is a certain percentage of the fair market value that is determined by local assessors to be the total taxable value of land and additions on the property. | Land | Improvement |
|---|---|---|---|---|
| 2025 | $2,124 | $188,398 | $37,677 | $150,721 |
| 2024 | $2,124 | $184,705 | $36,939 | $147,766 |
| 2023 | $2,059 | $181,084 | $36,215 | $144,869 |
| 2022 | $2,034 | $177,534 | $35,505 | $142,029 |
| 2021 | $2,015 | $174,054 | $34,809 | $139,245 |
| 2020 | $1,968 | $172,271 | $34,453 | $137,818 |
| 2019 | $1,920 | $168,894 | $33,778 | $135,116 |
| 2018 | $1,981 | $165,583 | $33,116 | $132,467 |
| 2017 | $1,890 | $162,337 | $32,467 | $129,870 |
| 2016 | $1,870 | $159,155 | $31,831 | $127,324 |
| 2015 | $1,746 | $156,765 | $31,353 | $125,412 |
| 2014 | $1,731 | $153,695 | $30,739 | $122,956 |
Source: Public Records
Map
Nearby Homes