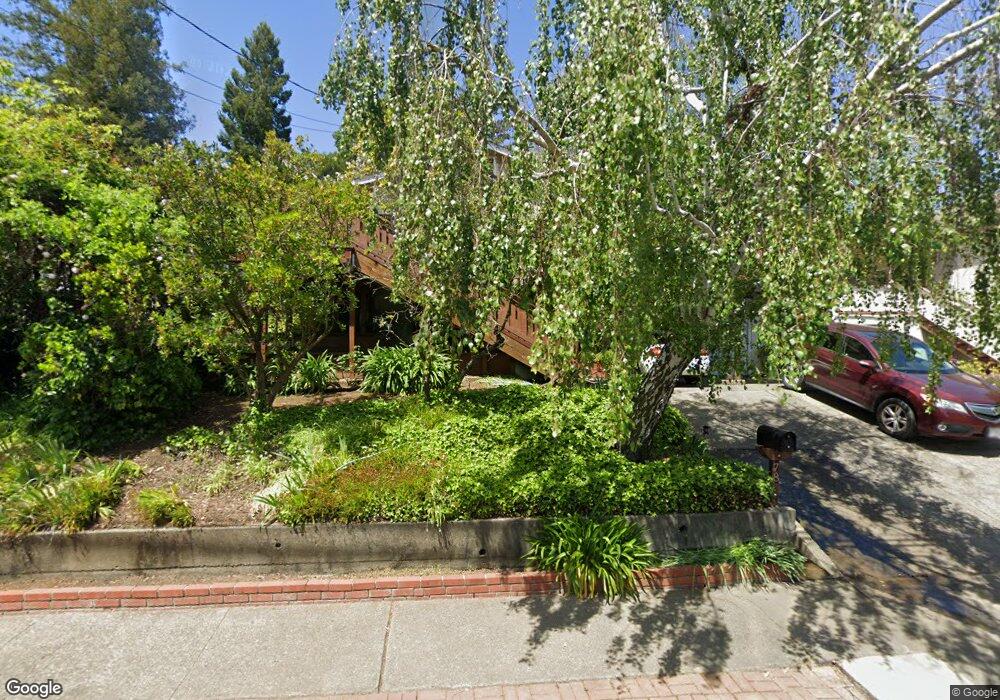
281 Crescent Rd Unit A San Anselmo, CA 94960
Estimated Value: $3,367,292 - $3,723,000
6
Beds
4
Baths
3,219
Sq Ft
$1,127/Sq Ft
Est. Value
About This Home
This home is located at 281 Crescent Rd Unit A, San Anselmo, CA 94960 and is currently estimated at $3,627,823, approximately $1,127 per square foot. 281 Crescent Rd Unit A is a home located in Marin County with nearby schools including Wade Thomas Elementary School, White Hill Middle School, and Archie Williams High School.
Ownership History
Date
Name
Owned For
Owner Type
Purchase Details
Closed on
May 13, 2025
Sold by
Marc And Lucy Schneidman Living Trust and Schneidman Marc R
Bought by
Arb And Kad Llc
Current Estimated Value
Purchase Details
Closed on
Nov 17, 2000
Sold by
Schneidman Marc R and Schneidman Lucy C
Bought by
Schneidman Marc R and Schneidman Lucy C
Home Financials for this Owner
Home Financials are based on the most recent Mortgage that was taken out on this home.
Original Mortgage
$650,000
Interest Rate
7.13%
Purchase Details
Closed on
May 13, 1997
Sold by
Richard Hochschild and Maureen Hochschild
Bought by
Schneidman Marc R and Schneidman Lucy C
Home Financials for this Owner
Home Financials are based on the most recent Mortgage that was taken out on this home.
Original Mortgage
$500,000
Interest Rate
8.15%
Create a Home Valuation Report for This Property
The Home Valuation Report is an in-depth analysis detailing your home's value as well as a comparison with similar homes in the area
Home Values in the Area
Average Home Value in this Area
Purchase History
| Date | Buyer | Sale Price | Title Company |
|---|---|---|---|
| Arb And Kad Llc | $3,750,000 | Old Republic Title | |
| Schneidman Marc R | -- | -- | |
| Schneidman Marc R | -- | Cal Land Title | |
| Schneidman Marc R | $782,500 | First American Title Co |
Source: Public Records
Mortgage History
| Date | Status | Borrower | Loan Amount |
|---|---|---|---|
| Previous Owner | Schneidman Marc R | $650,000 | |
| Previous Owner | Schneidman Marc R | $500,000 | |
| Closed | Schneidman Marc R | $325,000 |
Source: Public Records
Tax History Compared to Growth
Tax History
| Year | Tax Paid | Tax Assessment Tax Assessment Total Assessment is a certain percentage of the fair market value that is determined by local assessors to be the total taxable value of land and additions on the property. | Land | Improvement |
|---|---|---|---|---|
| 2025 | $19,070 | $1,404,938 | $615,802 | $789,136 |
| 2024 | $19,070 | $1,377,393 | $603,728 | $773,665 |
| 2023 | $18,993 | $1,350,391 | $591,893 | $758,498 |
| 2022 | $18,804 | $1,323,914 | $580,288 | $743,626 |
| 2021 | $18,461 | $1,297,956 | $568,910 | $729,046 |
| 2020 | $18,279 | $1,284,654 | $563,080 | $721,574 |
| 2019 | $17,706 | $1,259,472 | $552,042 | $707,430 |
| 2018 | $17,220 | $1,234,783 | $541,220 | $693,563 |
| 2017 | $16,889 | $1,210,576 | $530,610 | $679,966 |
| 2016 | $16,125 | $1,186,844 | $520,208 | $666,636 |
| 2015 | $15,736 | $1,139,471 | $512,396 | $627,075 |
| 2014 | $15,157 | $1,117,154 | $502,360 | $614,794 |
Source: Public Records
Map
Nearby Homes
- 265 Crescent Rd
- 144 Melville Ave
- 745 Redwood Rd
- 739 Redwood Rd
- 723 Redwood Rd
- 711 San Anselmo Ave
- 52 Austin Ave
- 19 Belle Ave
- 84 Madrone Ave Unit 20
- 84 Madrone Ave Unit 1
- 125 Oak Ave
- 74 Sir Francis Drake Blvd
- 5 W Hillside Ave
- 31 Baywood Ave
- 19 Allyn Ave
- 60 Crest Ave
- 63 Ivy Dr
- 1019 Sir Francis Drake Blvd
- 16 Sunny Dr
- 53 Foothill Rd