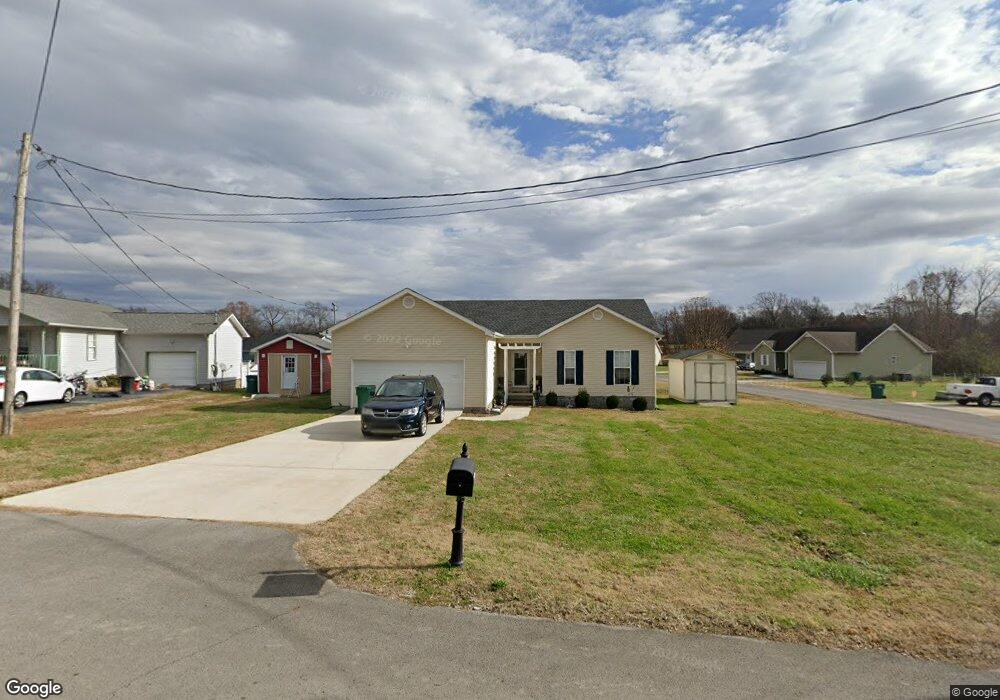
281 Duncan Ln Winchester, TN 37398
Estimated Value: $222,000 - $273,000
--
Bed
2
Baths
1,280
Sq Ft
$191/Sq Ft
Est. Value
About This Home
This home is located at 281 Duncan Ln, Winchester, TN 37398 and is currently estimated at $244,610, approximately $191 per square foot. 281 Duncan Ln is a home located in Franklin County with nearby schools including South Middle School, Franklin County High School, and Winchester Christian Academy.
Ownership History
Date
Name
Owned For
Owner Type
Purchase Details
Closed on
Dec 11, 2020
Sold by
Miller Anthony Q
Bought by
Broach Jennifer Ann
Current Estimated Value
Home Financials for this Owner
Home Financials are based on the most recent Mortgage that was taken out on this home.
Original Mortgage
$110,960
Outstanding Balance
$98,787
Interest Rate
2.7%
Mortgage Type
New Conventional
Estimated Equity
$145,823
Purchase Details
Closed on
Mar 30, 2020
Sold by
Myers Carl David
Bought by
Miller Anthony Q
Purchase Details
Closed on
Feb 11, 2009
Sold by
Amtrust Bank
Bought by
Myers Carl David
Purchase Details
Closed on
Aug 28, 2008
Sold by
Federal National Mortgage Association
Bought by
Amtrust Bank
Purchase Details
Closed on
Feb 27, 2008
Sold by
Hanley Jimmy
Bought by
Federal National Mtg Associati
Purchase Details
Closed on
May 29, 2007
Sold by
Morris Brent
Bought by
Hanley Jimmy
Purchase Details
Closed on
Jan 18, 2007
Sold by
Phillips Larry D
Bought by
Morris Brent
Create a Home Valuation Report for This Property
The Home Valuation Report is an in-depth analysis detailing your home's value as well as a comparison with similar homes in the area
Home Values in the Area
Average Home Value in this Area
Purchase History
| Date | Buyer | Sale Price | Title Company |
|---|---|---|---|
| Broach Jennifer Ann | $138,700 | Sovereign Title | |
| Miller Anthony Q | $134,000 | Sovereign T&E Llc | |
| Myers Carl David | $79,000 | -- | |
| Amtrust Bank | $101,060 | -- | |
| Federal National Mtg Associati | -- | -- | |
| Hanley Jimmy | $125,900 | -- | |
| Morris Brent | $22,500 | -- |
Source: Public Records
Mortgage History
| Date | Status | Borrower | Loan Amount |
|---|---|---|---|
| Open | Broach Jennifer Ann | $110,960 |
Source: Public Records
Tax History Compared to Growth
Tax History
| Year | Tax Paid | Tax Assessment Tax Assessment Total Assessment is a certain percentage of the fair market value that is determined by local assessors to be the total taxable value of land and additions on the property. | Land | Improvement |
|---|---|---|---|---|
| 2024 | $1,237 | $48,100 | $7,500 | $40,600 |
| 2023 | $1,237 | $48,100 | $7,500 | $40,600 |
| 2022 | $1,213 | $48,100 | $7,500 | $40,600 |
| 2021 | $794 | $48,100 | $7,500 | $40,600 |
| 2020 | $1,096 | $31,000 | $4,825 | $26,175 |
| 2019 | $1,096 | $31,000 | $4,825 | $26,175 |
| 2018 | $1,032 | $31,000 | $4,825 | $26,175 |
| 2017 | $1,032 | $31,000 | $4,825 | $26,175 |
| 2016 | $964 | $28,925 | $4,825 | $24,100 |
| 2015 | $945 | $28,925 | $4,825 | $24,100 |
| 2014 | $945 | $28,917 | $0 | $0 |
Source: Public Records
Map
Nearby Homes
- 0 Sherry St
- 139 Sherry St
- 319 Campfire Ct
- 171 Cypress Point Dr
- 155 Cypress Point Dr
- 397 Campfire Ct
- 407 Girton St
- 101 Cypress Point Dr
- 1 Campfire Ct
- 316 Campfire Ct
- 346 Campfire Ct
- 73 Cypress Point Dr
- 65 Pontoon Place
- 6026 Lynchburg Rd
- 159 Canoe Ct
- 50 Pontoon Place
- 146 Island Way
- 974 Lynchburg Rd
- 120 Pontoon Place
- 58 Island Way