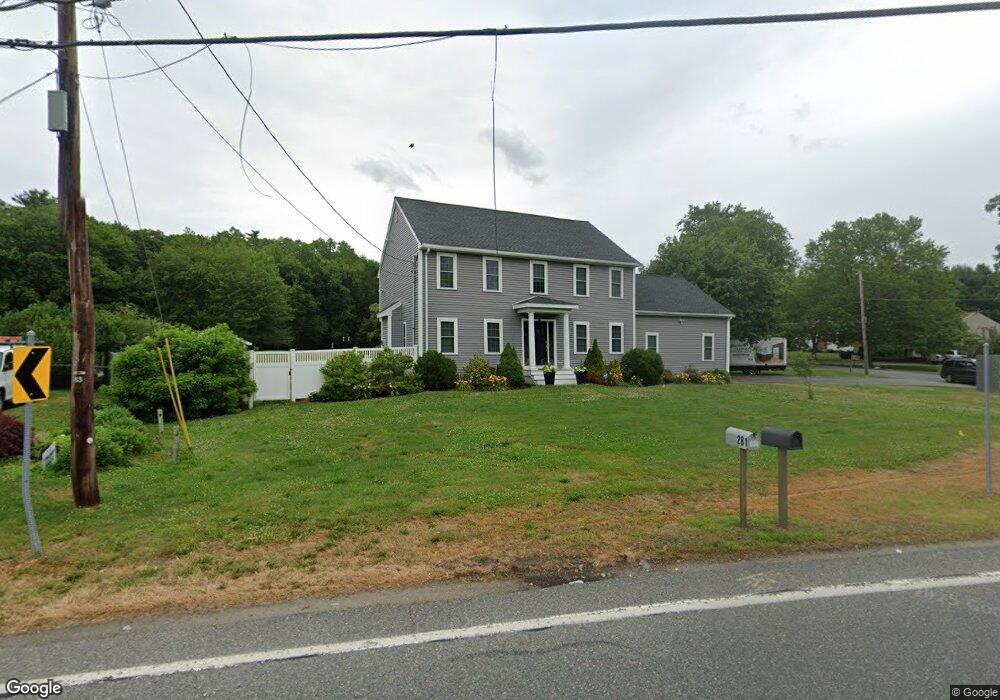
281 Elm St East Bridgewater, MA 02333
Estimated Value: $638,137 - $803,000
3
Beds
2
Baths
936
Sq Ft
$749/Sq Ft
Est. Value
About This Home
This home is located at 281 Elm St, East Bridgewater, MA 02333 and is currently estimated at $701,284, approximately $749 per square foot. 281 Elm St is a home located in Plymouth County with nearby schools including Central Elementary School, Gordon W Mitchell Middle School, and East Bridgewater Jr./Sr. High School.
Ownership History
Date
Name
Owned For
Owner Type
Purchase Details
Closed on
Apr 1, 2016
Sold by
Fortes Alcides C
Bought by
Fortes Alcides C and Fortes Mariajose P
Current Estimated Value
Purchase Details
Closed on
Feb 19, 2015
Sold by
Altisource Solutions I
Bought by
Fortes Alcides C
Purchase Details
Closed on
Sep 16, 2014
Sold by
Hill Shirley E and Hill Edward E
Bought by
Hsbc Bank Usa Na
Purchase Details
Closed on
Aug 14, 1997
Sold by
Gallagher Harry G
Bought by
Hill Edward E and Hill Shirley E
Create a Home Valuation Report for This Property
The Home Valuation Report is an in-depth analysis detailing your home's value as well as a comparison with similar homes in the area
Home Values in the Area
Average Home Value in this Area
Purchase History
| Date | Buyer | Sale Price | Title Company |
|---|---|---|---|
| Fortes Alcides C | -- | -- | |
| Fortes Alcides C | $147,000 | -- | |
| Hsbc Bank Usa Na | $211,981 | -- | |
| Hill Edward E | $110,000 | -- |
Source: Public Records
Mortgage History
| Date | Status | Borrower | Loan Amount |
|---|---|---|---|
| Previous Owner | Hill Edward E | $20,000 | |
| Previous Owner | Hill Edward E | $244,800 | |
| Previous Owner | Hill Edward E | $230,000 |
Source: Public Records
Tax History Compared to Growth
Tax History
| Year | Tax Paid | Tax Assessment Tax Assessment Total Assessment is a certain percentage of the fair market value that is determined by local assessors to be the total taxable value of land and additions on the property. | Land | Improvement |
|---|---|---|---|---|
| 2025 | $8,503 | $622,000 | $179,500 | $442,500 |
| 2024 | $8,346 | $603,000 | $172,600 | $430,400 |
| 2023 | $8,154 | $564,300 | $172,600 | $391,700 |
| 2022 | $7,914 | $507,300 | $157,000 | $350,300 |
| 2021 | $7,674 | $450,100 | $150,800 | $299,300 |
| 2020 | $7,538 | $436,000 | $145,100 | $290,900 |
| 2019 | $7,354 | $418,800 | $138,600 | $280,200 |
| 2018 | $10,271 | $395,100 | $138,600 | $256,500 |
| 2017 | $6,939 | $379,200 | $132,200 | $247,000 |
| 2016 | $2,871 | $158,100 | $132,200 | $25,900 |
| 2015 | $4,124 | $232,200 | $131,300 | $100,900 |
| 2014 | $3,957 | $227,800 | $128,500 | $99,300 |
Source: Public Records
Map
Nearby Homes
- 446 Elm St
- 416 Highland St
- 11 Willow Ave
- 22 Water St
- 25 Plain St
- 11 Harmony Crossing
- 585 N Bedford St
- 20 Plain St
- 611 N Bedford St
- 41 Bedford St
- 505 N Central St
- 407 W Union St
- 848 N Bedford St Phase III
- 848 N Bedford St
- 848 N Bedford St Phase IV
- 848 N
- 282 Spring St
- 71 Church St
- 50 Belmont St
- 9 Hemlock Dr