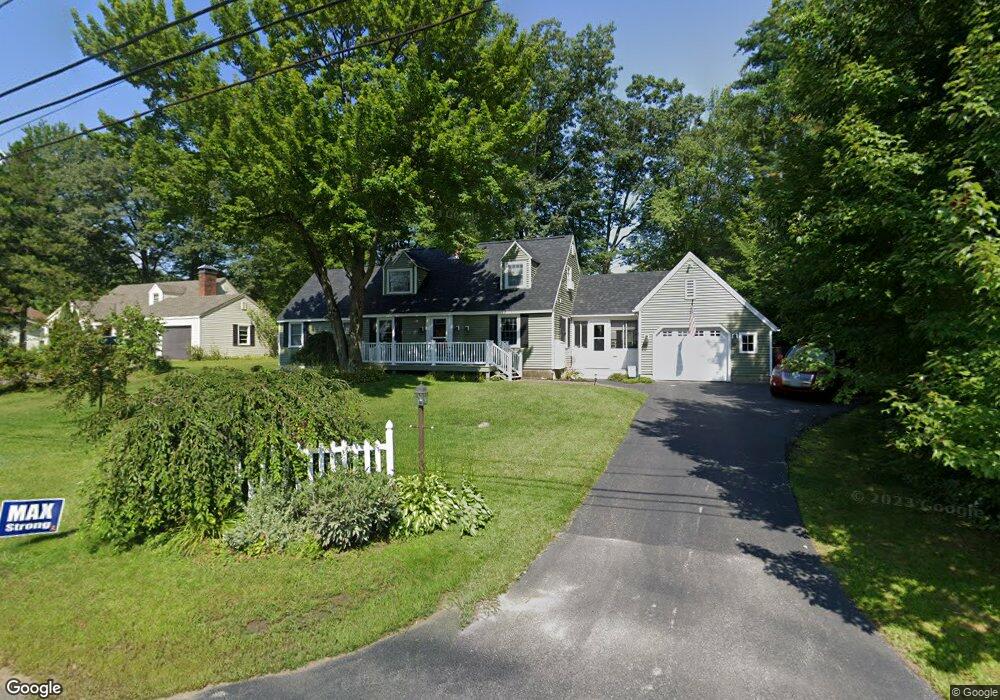
281 Holman St Laconia, NH 03246
Estimated Value: $516,000 - $545,000
3
Beds
2
Baths
1,485
Sq Ft
$358/Sq Ft
Est. Value
About This Home
This home is located at 281 Holman St, Laconia, NH 03246 and is currently estimated at $532,323, approximately $358 per square foot. 281 Holman St is a home located in Belknap County with nearby schools including Laconia Middle School, Laconia High School, and Holy Trinity Catholic School.
Ownership History
Date
Name
Owned For
Owner Type
Purchase Details
Closed on
Jan 9, 2009
Sold by
Us Bank Na Tr
Bought by
Wheeler Michael L and Wheeler Carole L
Current Estimated Value
Home Financials for this Owner
Home Financials are based on the most recent Mortgage that was taken out on this home.
Original Mortgage
$177,741
Outstanding Balance
$117,115
Interest Rate
5.99%
Mortgage Type
VA
Estimated Equity
$415,208
Purchase Details
Closed on
Sep 9, 2008
Sold by
Marvelle Christine
Bought by
Us Bank Na
Purchase Details
Closed on
Oct 31, 2005
Sold by
Huot June M
Bought by
Dee Joseph H and Marvelle Christine
Home Financials for this Owner
Home Financials are based on the most recent Mortgage that was taken out on this home.
Original Mortgage
$184,000
Interest Rate
8%
Mortgage Type
Adjustable Rate Mortgage/ARM
Create a Home Valuation Report for This Property
The Home Valuation Report is an in-depth analysis detailing your home's value as well as a comparison with similar homes in the area
Home Values in the Area
Average Home Value in this Area
Purchase History
| Date | Buyer | Sale Price | Title Company |
|---|---|---|---|
| Wheeler Michael L | $168,000 | -- | |
| Us Bank Na | $216,800 | -- | |
| Dee Joseph H | $230,000 | -- |
Source: Public Records
Mortgage History
| Date | Status | Borrower | Loan Amount |
|---|---|---|---|
| Open | Us Bank Na | $177,741 | |
| Previous Owner | Dee Joseph H | $184,000 |
Source: Public Records
Tax History Compared to Growth
Tax History
| Year | Tax Paid | Tax Assessment Tax Assessment Total Assessment is a certain percentage of the fair market value that is determined by local assessors to be the total taxable value of land and additions on the property. | Land | Improvement |
|---|---|---|---|---|
| 2024 | $5,794 | $425,100 | $152,800 | $272,300 |
| 2023 | $5,482 | $394,100 | $140,400 | $253,700 |
| 2022 | $4,713 | $317,400 | $132,800 | $184,600 |
| 2021 | $4,760 | $252,400 | $85,900 | $166,500 |
| 2020 | $4,701 | $238,400 | $75,500 | $162,900 |
| 2019 | $4,802 | $233,200 | $70,300 | $162,900 |
| 2018 | $4,800 | $230,200 | $70,300 | $159,900 |
| 2017 | $4,791 | $227,800 | $67,700 | $160,100 |
| 2016 | $4,598 | $207,100 | $62,500 | $144,600 |
| 2015 | $4,842 | $218,100 | $65,700 | $152,400 |
| 2014 | $4,702 | $209,900 | $65,300 | $144,600 |
| 2013 | $4,560 | $206,500 | $61,900 | $144,600 |
Source: Public Records
Map
Nearby Homes