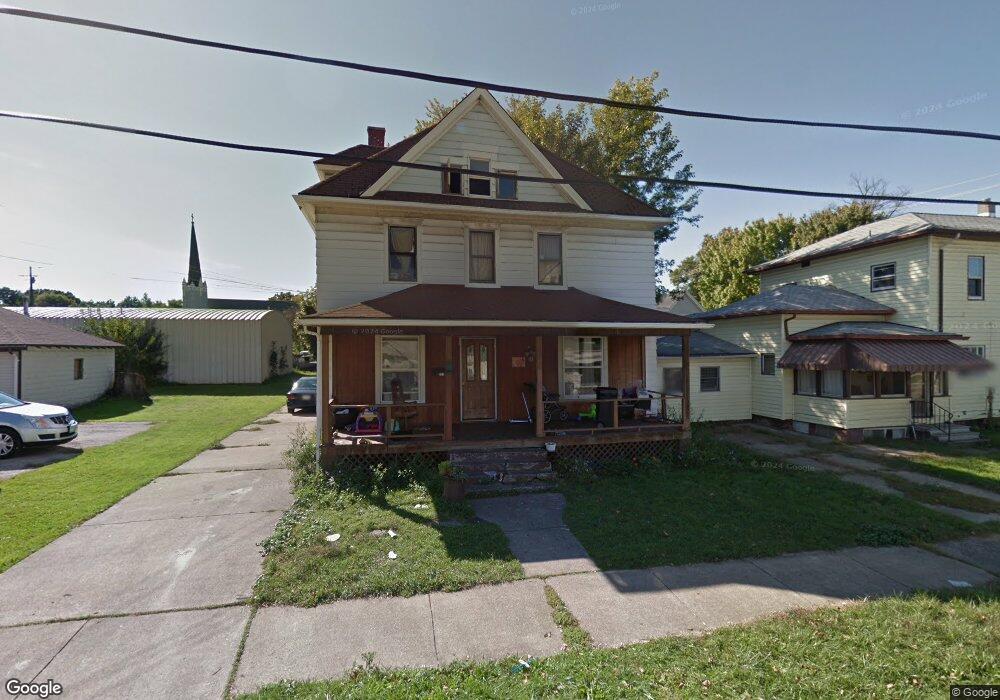
281 Orange St Conneaut, OH 44030
Estimated Value: $57,000 - $88,000
4
Beds
1
Bath
1,440
Sq Ft
$52/Sq Ft
Est. Value
About This Home
This home is located at 281 Orange St, Conneaut, OH 44030 and is currently estimated at $74,641, approximately $51 per square foot. 281 Orange St is a home located in Ashtabula County with nearby schools including Lakeshore Primary Elementary School, Gateway Elementary School, and Conneaut Middle School.
Ownership History
Date
Name
Owned For
Owner Type
Purchase Details
Closed on
Feb 11, 2019
Sold by
Equity & Help Inc
Bought by
Mccall Patrick J
Current Estimated Value
Purchase Details
Closed on
Jun 20, 2017
Sold by
Ki Consulting Group Llc
Bought by
My Family House Llc
Purchase Details
Closed on
Mar 3, 2017
Sold by
Harbour Portfollo Vi Lp
Bought by
Ki Consulting Group Llc
Purchase Details
Closed on
Jan 5, 2012
Sold by
Harbour Portfolio Vi Lp
Bought by
Nordquest Christina A and Nordquest Tammie L
Home Financials for this Owner
Home Financials are based on the most recent Mortgage that was taken out on this home.
Original Mortgage
$31,500
Interest Rate
10%
Mortgage Type
Seller Take Back
Purchase Details
Closed on
Apr 7, 2011
Sold by
Fannie Mae
Bought by
Harbour Portfolio Vi Lp
Purchase Details
Closed on
Aug 23, 2010
Sold by
Eaton Mark A
Bought by
Fanniemae and Federal National Mortgage Association
Create a Home Valuation Report for This Property
The Home Valuation Report is an in-depth analysis detailing your home's value as well as a comparison with similar homes in the area
Home Values in the Area
Average Home Value in this Area
Purchase History
| Date | Buyer | Sale Price | Title Company |
|---|---|---|---|
| Mccall Patrick J | -- | None Available | |
| My Family House Llc | $11,300 | None Available | |
| Ki Consulting Group Llc | $45,000 | None Available | |
| Nordquest Christina A | $32,000 | None Available | |
| Harbour Portfolio Vi Lp | $6,236 | None Available | |
| Fanniemae | $24,000 | None Available |
Source: Public Records
Mortgage History
| Date | Status | Borrower | Loan Amount |
|---|---|---|---|
| Previous Owner | Nordquest Christina A | $31,500 |
Source: Public Records
Tax History
| Year | Tax Paid | Tax Assessment Tax Assessment Total Assessment is a certain percentage of the fair market value that is determined by local assessors to be the total taxable value of land and additions on the property. | Land | Improvement |
|---|---|---|---|---|
| 2024 | $1,106 | $15,120 | $1,680 | $13,440 |
| 2023 | $721 | $15,120 | $1,680 | $13,440 |
| 2022 | $631 | $11,630 | $1,300 | $10,330 |
| 2021 | $641 | $11,630 | $1,300 | $10,330 |
| 2020 | $641 | $11,630 | $1,300 | $10,330 |
| 2019 | $608 | $10,820 | $910 | $9,910 |
| 2018 | $580 | $10,820 | $910 | $9,910 |
| 2017 | $579 | $10,820 | $910 | $9,910 |
| 2016 | $770 | $15,760 | $1,300 | $14,460 |
| 2015 | $1,554 | $15,760 | $1,300 | $14,460 |
| 2014 | $671 | $15,760 | $1,300 | $14,460 |
| 2013 | $631 | $15,230 | $1,230 | $14,000 |
Source: Public Records
Map
Nearby Homes
- 475 State St
- 536 Madison St
- 681 Madison St
- 450 Buffalo St
- 375 Bliss Ave
- 386 Washington St
- 474 Sherman St
- 745 Maple Ave
- 284 Clay St
- 146 Nickle Plate Ave
- 238 Whitney St
- 855 Spring St Unit S9
- 18 Hillcrest Ct
- 716 Chestnut St
- 110 Edgewood Dr
- 169 River St
- 0 Dorman Rd
- 992 Mill St
- VL Center Rd
- 210 W Main Rd
Your Personal Tour Guide
Ask me questions while you tour the home.