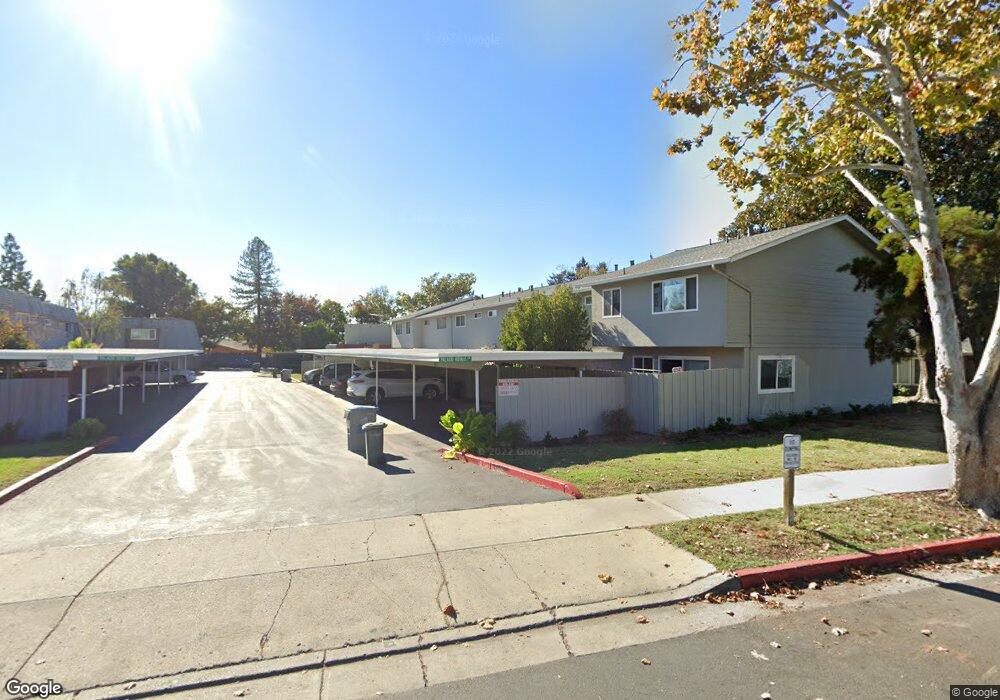
281 Palacio Royale Cir San Jose, CA 95116
Checkers NeighborhoodEstimated Value: $623,000 - $671,000
3
Beds
2
Baths
1,180
Sq Ft
$551/Sq Ft
Est. Value
About This Home
This home is located at 281 Palacio Royale Cir, San Jose, CA 95116 and is currently estimated at $650,439, approximately $551 per square foot. 281 Palacio Royale Cir is a home located in Santa Clara County with nearby schools including San Antonio Elementary School, Independence High School, and Rocketship Fuerza Community Prep.
Ownership History
Date
Name
Owned For
Owner Type
Purchase Details
Closed on
Feb 2, 2025
Sold by
Robles Francisco
Bought by
Robles Francisco and Deborbon Maria De
Current Estimated Value
Purchase Details
Closed on
Jan 11, 2007
Sold by
Doumercborbon Maria De Lourdes
Bought by
Robles Francisco
Home Financials for this Owner
Home Financials are based on the most recent Mortgage that was taken out on this home.
Original Mortgage
$345,000
Interest Rate
6.12%
Mortgage Type
New Conventional
Purchase Details
Closed on
Nov 12, 2004
Sold by
Freitas Cleretta C and Freitas Kenneth Roger
Bought by
Robles Francisco
Home Financials for this Owner
Home Financials are based on the most recent Mortgage that was taken out on this home.
Original Mortgage
$132,800
Interest Rate
5.72%
Mortgage Type
Seller Take Back
Create a Home Valuation Report for This Property
The Home Valuation Report is an in-depth analysis detailing your home's value as well as a comparison with similar homes in the area
Home Values in the Area
Average Home Value in this Area
Purchase History
| Date | Buyer | Sale Price | Title Company |
|---|---|---|---|
| Robles Francisco | -- | None Listed On Document | |
| Robles Francisco | -- | Financial Title Company | |
| Robles Francisco | $332,000 | Chicago Title |
Source: Public Records
Mortgage History
| Date | Status | Borrower | Loan Amount |
|---|---|---|---|
| Previous Owner | Robles Francisco | $345,000 | |
| Previous Owner | Robles Francisco | $132,800 | |
| Closed | Robles Francisco | $199,200 |
Source: Public Records
Tax History Compared to Growth
Tax History
| Year | Tax Paid | Tax Assessment Tax Assessment Total Assessment is a certain percentage of the fair market value that is determined by local assessors to be the total taxable value of land and additions on the property. | Land | Improvement |
|---|---|---|---|---|
| 2025 | $7,437 | $462,758 | $208,239 | $254,519 |
| 2024 | $7,437 | $453,685 | $204,156 | $249,529 |
| 2023 | $7,276 | $444,790 | $200,153 | $244,637 |
| 2022 | $7,137 | $436,070 | $196,229 | $239,841 |
| 2021 | $6,882 | $427,521 | $192,382 | $235,139 |
| 2020 | $6,733 | $423,138 | $190,410 | $232,728 |
| 2019 | $6,542 | $414,842 | $186,677 | $228,165 |
| 2018 | $6,451 | $406,709 | $183,017 | $223,692 |
| 2017 | $6,465 | $398,735 | $179,429 | $219,306 |
| 2016 | $6,102 | $390,917 | $175,911 | $215,006 |
| 2015 | $5,612 | $348,000 | $156,600 | $191,400 |
| 2014 | $4,782 | $315,000 | $141,700 | $173,300 |
Source: Public Records
Map
Nearby Homes
- 1826 Perrone Cir
- 295 Esmeralda Ct
- 67 Silcreek Dr
- 125 Magellan Ave
- 1715 Calle de Plata
- 2177 Alum Rock Ave Unit 112
- 88 N Jackson Ave Unit 322
- 88 N Jackson Ave Unit 105
- 76 Sunset Ct
- 64 Via de Guadalupe
- 264 N 34th St
- 210 Damsen Dr Unit 22
- 1816 Luby Dr Unit 46
- 86 Eastwood Ct
- 127 Schott St
- 171 S Sunset Ave
- 230 Montclair Ave
- 1622 Perry Ct
- 1672 E San Fernando St
- 1565 E Saint James St
- 279 Palacio Royale Cir
- 283 Palacio Royale Cir
- 285 Palacio Royale Cir
- 287 Palacio Royale Cir
- 300 Palacio Espada Ct
- 302 Palacio Espada Ct
- 298 Palacio Espada Ct
- 277 Palacio Royale Cir
- 304 Palacio Espada Ct
- 296 Palacio Espada Ct
- 289 Palacio Royale Cir
- 306 Palacio Espada Ct
- 275 Palacio Royale Cir
- 294 Palacio Espada Ct
- 308 Palacio Espada Ct
- 273 Palacio Royale Cir
- 284 Palacio Royale Cir
- 286 Palacio Royale Cir
- 288 Palacio Royale Cir
- 290 Palacio Royale Cir