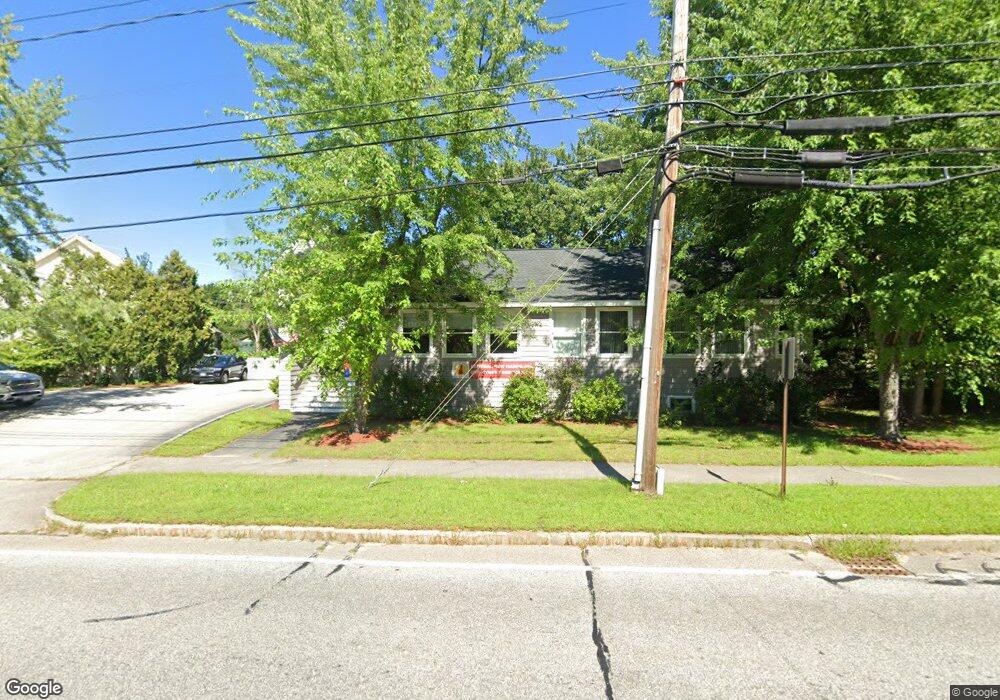
281 S Main St Laconia, NH 03246
Estimated Value: $458,861
--
Bed
1
Bath
1,364
Sq Ft
$336/Sq Ft
Est. Value
About This Home
This home is located at 281 S Main St, Laconia, NH 03246 and is currently estimated at $458,861, approximately $336 per square foot. 281 S Main St is a home located in Belknap County with nearby schools including Laconia Middle School, Laconia High School, and Holy Trinity Catholic School.
Ownership History
Date
Name
Owned For
Owner Type
Purchase Details
Closed on
Aug 19, 2015
Sold by
Js Pierson Llc
Bought by
Stcyr Real Estate Hldg
Current Estimated Value
Home Financials for this Owner
Home Financials are based on the most recent Mortgage that was taken out on this home.
Original Mortgage
$159,000
Outstanding Balance
$125,222
Interest Rate
4.07%
Mortgage Type
Commercial
Estimated Equity
$333,639
Purchase Details
Closed on
May 18, 1998
Sold by
Mcganty Roberta J
Bought by
J S Pearson Llc
Home Financials for this Owner
Home Financials are based on the most recent Mortgage that was taken out on this home.
Original Mortgage
$60,000
Interest Rate
7.08%
Mortgage Type
Commercial
Create a Home Valuation Report for This Property
The Home Valuation Report is an in-depth analysis detailing your home's value as well as a comparison with similar homes in the area
Home Values in the Area
Average Home Value in this Area
Purchase History
| Date | Buyer | Sale Price | Title Company |
|---|---|---|---|
| Stcyr Real Estate Hldg | $199,000 | -- | |
| J S Pearson Llc | $84,900 | -- |
Source: Public Records
Mortgage History
| Date | Status | Borrower | Loan Amount |
|---|---|---|---|
| Open | J S Pearson Llc | $159,000 | |
| Previous Owner | J S Pearson Llc | $60,000 |
Source: Public Records
Tax History Compared to Growth
Tax History
| Year | Tax Paid | Tax Assessment Tax Assessment Total Assessment is a certain percentage of the fair market value that is determined by local assessors to be the total taxable value of land and additions on the property. | Land | Improvement |
|---|---|---|---|---|
| 2024 | $3,541 | $259,800 | $82,500 | $177,300 |
| 2023 | $3,089 | $222,100 | $78,600 | $143,500 |
| 2022 | $3,349 | $225,500 | $78,600 | $146,900 |
| 2021 | $3,921 | $207,900 | $69,600 | $138,300 |
| 2020 | $4,100 | $207,900 | $69,600 | $138,300 |
| 2019 | $4,299 | $208,800 | $67,400 | $141,400 |
| 2018 | $4,243 | $203,500 | $67,400 | $136,100 |
| 2017 | $4,389 | $208,700 | $69,600 | $139,100 |
| 2016 | $4,533 | $204,200 | $65,100 | $139,100 |
| 2015 | $4,873 | $219,500 | $70,900 | $148,600 |
| 2014 | $4,946 | $220,800 | $70,600 | $150,200 |
| 2013 | $4,827 | $218,600 | $66,900 | $151,700 |
Source: Public Records
Map
Nearby Homes
- 45 Joliet St
- 40 Bowman St
- 87 Academy St
- 18-20 Cleveland Place
- 123 Merrimac St
- 13 Lindsay Ct
- 42 Beaman St
- 33 Avery St
- 65 Broadview Dr Unit 1
- 37 Vantagepoint Dr Unit 3
- 45 Lafayette St
- 17 Rowell St
- 44 Highland St
- 98 Water St
- 33 S Main St
- 17 Arch St
- 284 Pine St
- 84 Spring St
- Lot 1 Winter St
- 7 Riverside Ct