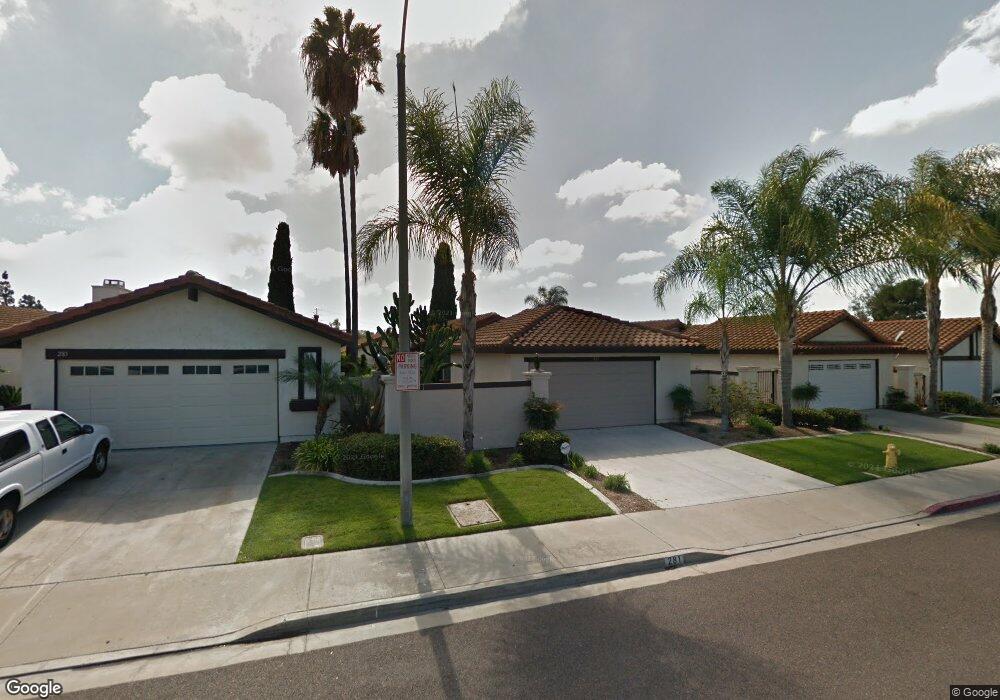
281 Sorrel Tree Place Oceanside, CA 92057
San Luis Rey NeighborhoodEstimated Value: $686,209 - $729,000
3
Beds
2
Baths
1,006
Sq Ft
$707/Sq Ft
Est. Value
About This Home
This home is located at 281 Sorrel Tree Place, Oceanside, CA 92057 and is currently estimated at $711,302, approximately $707 per square foot. 281 Sorrel Tree Place is a home located in San Diego County with nearby schools including Del Rio Elementary School, Cesar Chavez Middle School, and Scholarship Prep Oceanside.
Ownership History
Date
Name
Owned For
Owner Type
Purchase Details
Closed on
Apr 25, 2020
Sold by
Nelson Christine A and Nelson Christine Ann
Bought by
Nelson Christine A and Nelson Richard A
Current Estimated Value
Home Financials for this Owner
Home Financials are based on the most recent Mortgage that was taken out on this home.
Original Mortgage
$258,000
Outstanding Balance
$229,895
Interest Rate
3.6%
Mortgage Type
New Conventional
Estimated Equity
$481,407
Purchase Details
Closed on
Nov 8, 2007
Sold by
The Bank Of New York Trust Co Na
Bought by
Nelson Christine Ann
Home Financials for this Owner
Home Financials are based on the most recent Mortgage that was taken out on this home.
Original Mortgage
$256,500
Interest Rate
5.37%
Mortgage Type
Unknown
Purchase Details
Closed on
Feb 28, 2007
Sold by
Rodriguez Brian
Bought by
The Bank Of New York Trust Co Na
Purchase Details
Closed on
Nov 18, 2004
Sold by
Rodriguez Brian H and Ramirez Ma Gloria
Bought by
Rodriguez Brian
Home Financials for this Owner
Home Financials are based on the most recent Mortgage that was taken out on this home.
Original Mortgage
$315,000
Interest Rate
7.6%
Mortgage Type
Stand Alone Refi Refinance Of Original Loan
Purchase Details
Closed on
Nov 3, 2004
Sold by
Rodriguez Brian H and Rodriguez Brian
Bought by
Rodriguez Brian H and Rodriguez Liliana
Home Financials for this Owner
Home Financials are based on the most recent Mortgage that was taken out on this home.
Original Mortgage
$315,000
Interest Rate
7.6%
Mortgage Type
Stand Alone Refi Refinance Of Original Loan
Purchase Details
Closed on
Nov 5, 2002
Sold by
Rodriguez Liliana
Bought by
Rodriguez Brian H
Home Financials for this Owner
Home Financials are based on the most recent Mortgage that was taken out on this home.
Original Mortgage
$246,137
Interest Rate
5.89%
Mortgage Type
FHA
Purchase Details
Closed on
Oct 4, 2002
Sold by
Hoang Tong Tony and Hoang Lai Nguyen
Bought by
Rodriguez Brian H and Ramirez Magloria
Home Financials for this Owner
Home Financials are based on the most recent Mortgage that was taken out on this home.
Original Mortgage
$246,137
Interest Rate
5.89%
Mortgage Type
FHA
Purchase Details
Closed on
Jun 15, 1999
Sold by
Ton Tue That
Bought by
Hoang Tong Tony
Purchase Details
Closed on
Aug 1, 1989
Purchase Details
Closed on
May 17, 1989
Purchase Details
Closed on
Jul 29, 1987
Purchase Details
Closed on
Jan 27, 1986
Create a Home Valuation Report for This Property
The Home Valuation Report is an in-depth analysis detailing your home's value as well as a comparison with similar homes in the area
Home Values in the Area
Average Home Value in this Area
Purchase History
| Date | Buyer | Sale Price | Title Company |
|---|---|---|---|
| Nelson Christine A | -- | Pacific Coast Title Company | |
| Nelson Christine Ann | $270,000 | First American Title | |
| Nelson Christine Ann | -- | First American Title | |
| The Bank Of New York Trust Co Na | $336,981 | First American Title | |
| Rodriguez Brian | -- | Commonwealth Title | |
| Rodriguez Brian H | -- | -- | |
| Rodriguez Brian H | -- | Commonwealth Land Title Co | |
| Rodriguez Brian H | $250,000 | Commonwealth Land Title Co | |
| Hoang Tong Tony | -- | -- | |
| -- | $136,000 | -- | |
| -- | $117,000 | -- | |
| -- | $97,900 | -- | |
| -- | $78,000 | -- |
Source: Public Records
Mortgage History
| Date | Status | Borrower | Loan Amount |
|---|---|---|---|
| Open | Nelson Christine A | $258,000 | |
| Closed | Nelson Christine Ann | $256,500 | |
| Previous Owner | Rodriguez Brian | $315,000 | |
| Previous Owner | Rodriguez Brian H | $246,137 | |
| Closed | Rodriguez Brian H | $9,845 |
Source: Public Records
Tax History Compared to Growth
Tax History
| Year | Tax Paid | Tax Assessment Tax Assessment Total Assessment is a certain percentage of the fair market value that is determined by local assessors to be the total taxable value of land and additions on the property. | Land | Improvement |
|---|---|---|---|---|
| 2025 | $3,860 | $354,633 | $223,289 | $131,344 |
| 2024 | $3,860 | $347,680 | $218,911 | $128,769 |
| 2023 | $3,740 | $340,864 | $214,619 | $126,245 |
| 2022 | $3,682 | $334,181 | $210,411 | $123,770 |
| 2021 | $3,695 | $327,630 | $206,286 | $121,344 |
| 2020 | $3,581 | $324,271 | $204,171 | $120,100 |
| 2019 | $3,476 | $317,914 | $200,168 | $117,746 |
| 2018 | $3,438 | $311,682 | $196,244 | $115,438 |
| 2017 | $3,373 | $305,572 | $192,397 | $113,175 |
| 2016 | $3,262 | $299,581 | $188,625 | $110,956 |
| 2015 | $3,057 | $285,000 | $171,000 | $114,000 |
| 2014 | $2,733 | $260,000 | $156,000 | $104,000 |
Source: Public Records
Map
Nearby Homes
- 255 Flame Tree Place
- 4859 Gardenia St
- 4843 Sumac Place
- 258 Argus Way
- 4540 Arbor Glen Way
- 358 Via Metates
- 778 Sepia Ct
- 838 Mosaic Cir
- 232 Manzanilla Way
- 5166 Via Portola
- 5202 Via Tizon
- 4801 Siesta Place
- 166 Mckinley St
- 838 Masters Dr
- 652 Montage Rd
- 4824 Siesta Dr
- 5010 Golondrina Way Unit 64
- 339 La Purisma Way
- 343 La Purisma Way
- 5005 Codorniz Way Unit 8
- 277 Sorrel Tree Place
- 285 Sorrel Tree Place
- 273 Sorrel Tree Place
- 289 Sorrel Tree Place
- 274 Flame Tree Place
- 270 Flame Tree Place
- 278 Flame Tree Place
- 269 Sorrel Tree Place
- 293 Sorrel Tree Place
- 266 Flame Tree Place
- 4767 Macadamia Ct
- 282 Flame Tree Place Unit 8
- 4766 Macadamia Ct
- 265 Sorrel Tree Place
- 262 Flame Tree Place
- 297 Sorrel Tree Place
- 286 Flame Tree Place
- 4771 Macadamia Ct
- 258 Flame Tree Place
- 4770 Macadamia Ct