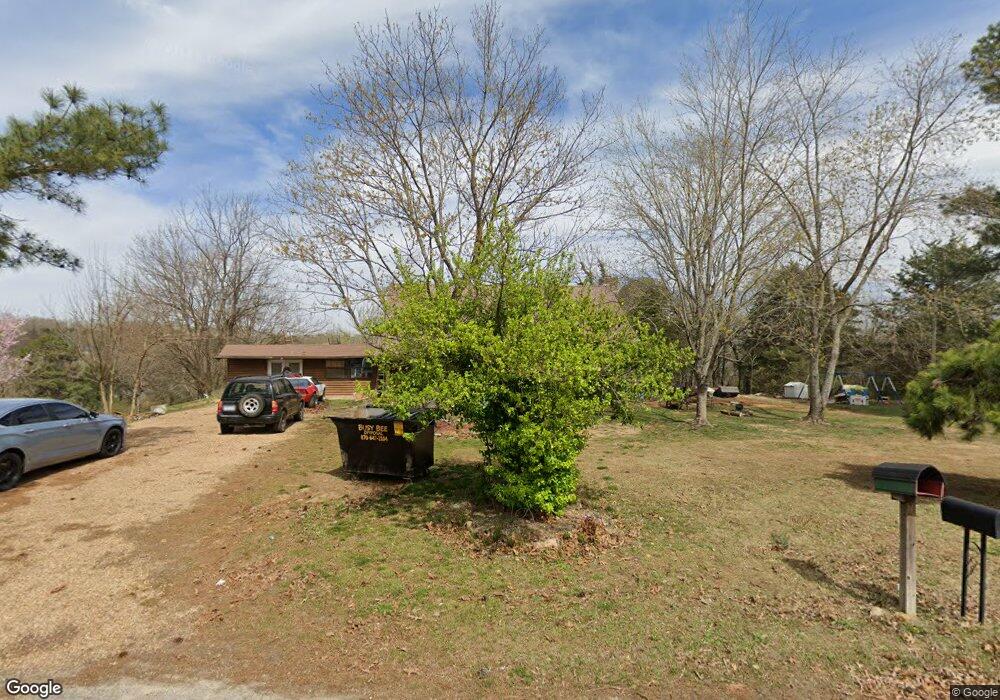
281 Spring St Maynard, AR 72444
Estimated Value: $149,138 - $286,000
3
Beds
2
Baths
2,622
Sq Ft
$74/Sq Ft
Est. Value
About This Home
This home is located at 281 Spring St, Maynard, AR 72444 and is currently estimated at $193,785, approximately $73 per square foot. 281 Spring St is a home located in Randolph County with nearby schools including Maynard Elementary School and Maynard High School.
Ownership History
Date
Name
Owned For
Owner Type
Purchase Details
Closed on
Sep 7, 2021
Sold by
Eveland Phade Laine and Estate Of Elaine Moreland
Bought by
Eveland Phabe Laine
Current Estimated Value
Purchase Details
Closed on
May 1, 1993
Bought by
Moreland Elaine
Purchase Details
Closed on
Oct 1, 1991
Bought by
Moreland To Moreland
Purchase Details
Closed on
Jan 1, 1983
Bought by
Briscoe To Moreland
Create a Home Valuation Report for This Property
The Home Valuation Report is an in-depth analysis detailing your home's value as well as a comparison with similar homes in the area
Purchase History
| Date | Buyer | Sale Price | Title Company |
|---|---|---|---|
| Eveland Phabe Laine | -- | None Available | |
| Moreland Elaine | -- | -- | |
| Eveland To Moreland | -- | -- | |
| Moreland To Moreland | -- | -- | |
| Briscoe To Moreland | -- | -- |
Source: Public Records
Tax History
| Year | Tax Paid | Tax Assessment Tax Assessment Total Assessment is a certain percentage of the fair market value that is determined by local assessors to be the total taxable value of land and additions on the property. | Land | Improvement |
|---|---|---|---|---|
| 2025 | $411 | $22,120 | $1,200 | $20,920 |
| 2024 | $1,011 | $22,120 | $1,200 | $20,920 |
| 2023 | $1,011 | $22,120 | $1,200 | $20,920 |
| 2022 | $1,011 | $22,120 | $1,200 | $20,920 |
| 2021 | $1,006 | $22,120 | $1,200 | $20,920 |
| 2020 | $539 | $20,010 | $1,200 | $18,810 |
| 2019 | $532 | $20,010 | $1,200 | $18,810 |
| 2018 | $516 | $20,010 | $1,200 | $18,810 |
| 2017 | $475 | $18,045 | $1,200 | $16,845 |
| 2016 | $402 | $18,045 | $1,200 | $16,845 |
| 2015 | $402 | $18,045 | $1,200 | $16,845 |
| 2014 | $366 | $18,045 | $1,200 | $16,845 |
Source: Public Records
Map
Nearby Homes
- 152 Lentz St
- 77 Mock St
- 13322 Arkansas 115
- 917 Hummingbird Trail
- 538 Fowler Rd
- 8771 Arkansas 115
- 43 Cheyenne Trail
- TBD Minorca Rd
- Tbd Minorca Rd Unit LotWP001
- 6546 Highway 115
- 6564 Highway 115 Unit LotWP001
- 8673 Highway 251
- 000 Carmickle Rd
- 831 Ripley Ff-1
- 1580 Sierra Loop
- 449 Thompson Rd
- 70 Kenzie Trail
- 4018 Country Club Rd
- 0 Cox Rd
- 4017 Country Club Rd
Your Personal Tour Guide
Ask me questions while you tour the home.