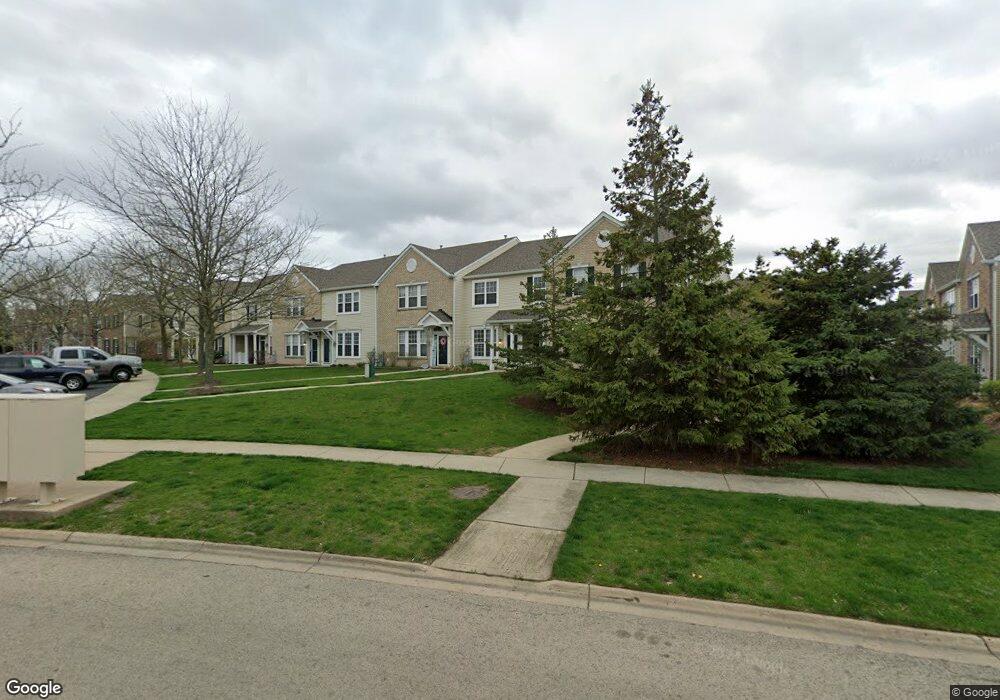
281 Springbrook Trail S Oswego, IL 60543
North Oswego NeighborhoodEstimated Value: $235,000 - $269,000
2
Beds
2
Baths
1,472
Sq Ft
$175/Sq Ft
Est. Value
About This Home
This home is located at 281 Springbrook Trail S, Oswego, IL 60543 and is currently estimated at $258,171, approximately $175 per square foot. 281 Springbrook Trail S is a home located in Kendall County with nearby schools including Long Beach Elementary School, Plank Junior High School, and Oswego East High School.
Ownership History
Date
Name
Owned For
Owner Type
Purchase Details
Closed on
May 25, 2017
Sold by
Fannie Mae
Bought by
Mendoza Carla N
Current Estimated Value
Home Financials for this Owner
Home Financials are based on the most recent Mortgage that was taken out on this home.
Original Mortgage
$149,246
Outstanding Balance
$123,590
Interest Rate
4.12%
Mortgage Type
FHA
Estimated Equity
$134,581
Purchase Details
Closed on
Dec 12, 2005
Sold by
Houkal Gladys
Bought by
Mccarthy Sarah
Home Financials for this Owner
Home Financials are based on the most recent Mortgage that was taken out on this home.
Original Mortgage
$166,000
Interest Rate
6.48%
Mortgage Type
Fannie Mae Freddie Mac
Purchase Details
Closed on
Feb 11, 2004
Sold by
Centex Homes
Bought by
Houkal Gladys C
Home Financials for this Owner
Home Financials are based on the most recent Mortgage that was taken out on this home.
Original Mortgage
$108,900
Interest Rate
4%
Mortgage Type
Purchase Money Mortgage
Create a Home Valuation Report for This Property
The Home Valuation Report is an in-depth analysis detailing your home's value as well as a comparison with similar homes in the area
Home Values in the Area
Average Home Value in this Area
Purchase History
| Date | Buyer | Sale Price | Title Company |
|---|---|---|---|
| Mendoza Carla N | -- | First American Title | |
| Mccarthy Sarah | $166,000 | Chicago Title Insurance Comp | |
| Houkal Gladys C | $136,500 | Chicago Title Insurance Co |
Source: Public Records
Mortgage History
| Date | Status | Borrower | Loan Amount |
|---|---|---|---|
| Open | Mendoza Carla N | $149,246 | |
| Previous Owner | Mccarthy Sarah | $166,000 | |
| Previous Owner | Houkal Gladys C | $108,900 |
Source: Public Records
Tax History
| Year | Tax Paid | Tax Assessment Tax Assessment Total Assessment is a certain percentage of the fair market value that is determined by local assessors to be the total taxable value of land and additions on the property. | Land | Improvement |
|---|---|---|---|---|
| 2024 | $5,307 | $71,944 | $12,992 | $58,952 |
| 2023 | $4,738 | $62,560 | $11,297 | $51,263 |
| 2022 | $4,738 | $58,467 | $10,558 | $47,909 |
| 2021 | $4,551 | $54,642 | $9,867 | $44,775 |
| 2020 | $4,446 | $53,051 | $9,580 | $43,471 |
| 2019 | $4,455 | $52,409 | $9,580 | $42,829 |
| 2018 | $4,042 | $44,664 | $8,164 | $36,500 |
| 2017 | $4,220 | $41,165 | $7,524 | $33,641 |
| 2016 | $1,946 | $37,423 | $6,840 | $30,583 |
| 2015 | $2,990 | $33,413 | $6,107 | $27,306 |
| 2014 | $3,227 | $31,521 | $5,761 | $25,760 |
| 2013 | $3,227 | $34,262 | $6,262 | $28,000 |
Source: Public Records
Map
Nearby Homes
- 309 Springbrook Trail S
- 303 Springbrook Trail S Unit 1
- 0000 Fifth St
- 410 Manchester Rd
- 502 Vernon Dr
- 623 Queen Dr
- 786 Bohannon Cir
- 790 Bohannon Cir
- 2071 Wiesbrook Dr
- 313 Kensington Dr
- 207 Long Beach Rd
- 225 Mondovi Dr
- 209 Huntington Ct
- 307 Huntington Ct
- 34 Sonora Dr
- 121 Preakness Dr
- 162 Heathgate Rd
- 810 Georgetown Dr
- 122 Longbeach Rd
- 651 Henry Ln
- 283 Springbrook Trail S Unit 1
- 283 Springbrook Trail S
- 279 Springbrook Trail S
- 285 Springbrook Trail S
- 285 Springbrook Trail S Unit 285
- 285 Springbrook Trail S
- 287 Springbrook Trail S
- 289 Springbrook Trail S
- 267 Springbrook Trail S
- 267 Springbrook Trail S
- 267 Springbrook Trail S
- 269 Springbrook Trail S
- 265 Springbrook Trail S
- 307 Springbrook Trail S Unit 1
- 271 Springbrook Trail S
- 291 Springbrook Trail S
- 273 Springbrook Trail S
- 275 Springbrook Trail S Unit 1
- 293 Springbrook Trail S Unit 1
- 277 Springbrook Trail S
Your Personal Tour Guide
Ask me questions while you tour the home.