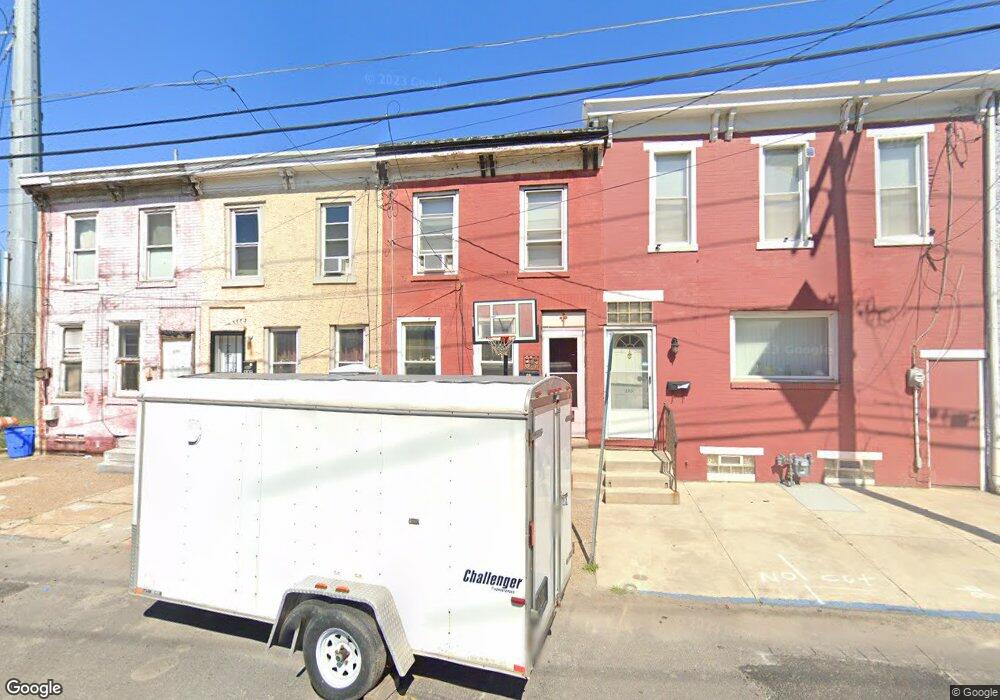
281 Walnut St Camden, NJ 08103
Central Waterfront NeighborhoodEstimated Value: $91,000 - $191,000
--
Bed
--
Bath
912
Sq Ft
$173/Sq Ft
Est. Value
About This Home
This home is located at 281 Walnut St, Camden, NJ 08103 and is currently estimated at $157,667, approximately $172 per square foot. 281 Walnut St is a home located in Camden County with nearby schools including Camden High School, Hope Community Charter School, and Leap Academy University Charter School.
Ownership History
Date
Name
Owned For
Owner Type
Purchase Details
Closed on
Mar 29, 2019
Sold by
Air Homes Ii Llc
Bought by
Anr Investments Llc
Current Estimated Value
Purchase Details
Closed on
Jan 11, 2019
Sold by
Kersey Brandon and Warren Anthony
Bought by
Air Homes Ii Llc
Purchase Details
Closed on
Apr 3, 2017
Sold by
Kensey Brandon
Bought by
Warren Anthony
Purchase Details
Closed on
Jul 23, 2009
Sold by
Blackshear Albert
Bought by
Kersey Brandon
Home Financials for this Owner
Home Financials are based on the most recent Mortgage that was taken out on this home.
Original Mortgage
$70,695
Interest Rate
4%
Mortgage Type
FHA
Purchase Details
Closed on
Dec 19, 2002
Sold by
Person Annie M
Bought by
Blackshear Albert
Create a Home Valuation Report for This Property
The Home Valuation Report is an in-depth analysis detailing your home's value as well as a comparison with similar homes in the area
Home Values in the Area
Average Home Value in this Area
Purchase History
| Date | Buyer | Sale Price | Title Company |
|---|---|---|---|
| Anr Investments Llc | -- | Your Hometown Title Llc | |
| Air Homes Ii Llc | $24,000 | None Available | |
| Warren Anthony | -- | None Available | |
| Kersey Brandon | $72,000 | -- | |
| Blackshear Albert | $12,000 | -- |
Source: Public Records
Mortgage History
| Date | Status | Borrower | Loan Amount |
|---|---|---|---|
| Previous Owner | Kersey Brandon | $70,695 |
Source: Public Records
Tax History Compared to Growth
Tax History
| Year | Tax Paid | Tax Assessment Tax Assessment Total Assessment is a certain percentage of the fair market value that is determined by local assessors to be the total taxable value of land and additions on the property. | Land | Improvement |
|---|---|---|---|---|
| 2025 | $886 | $25,000 | $4,700 | $20,300 |
| 2024 | $856 | $25,000 | $4,700 | $20,300 |
| 2023 | $856 | $25,000 | $4,700 | $20,300 |
| 2022 | $840 | $25,000 | $4,700 | $20,300 |
| 2021 | $837 | $25,000 | $4,700 | $20,300 |
| 2020 | $795 | $25,000 | $4,700 | $20,300 |
| 2019 | $761 | $25,000 | $4,700 | $20,300 |
| 2018 | $757 | $25,000 | $4,700 | $20,300 |
| 2017 | $739 | $25,000 | $4,700 | $20,300 |
| 2016 | $715 | $25,000 | $4,700 | $20,300 |
| 2015 | $689 | $25,000 | $4,700 | $20,300 |
| 2014 | $672 | $25,000 | $4,700 | $20,300 |
Source: Public Records
Map
Nearby Homes