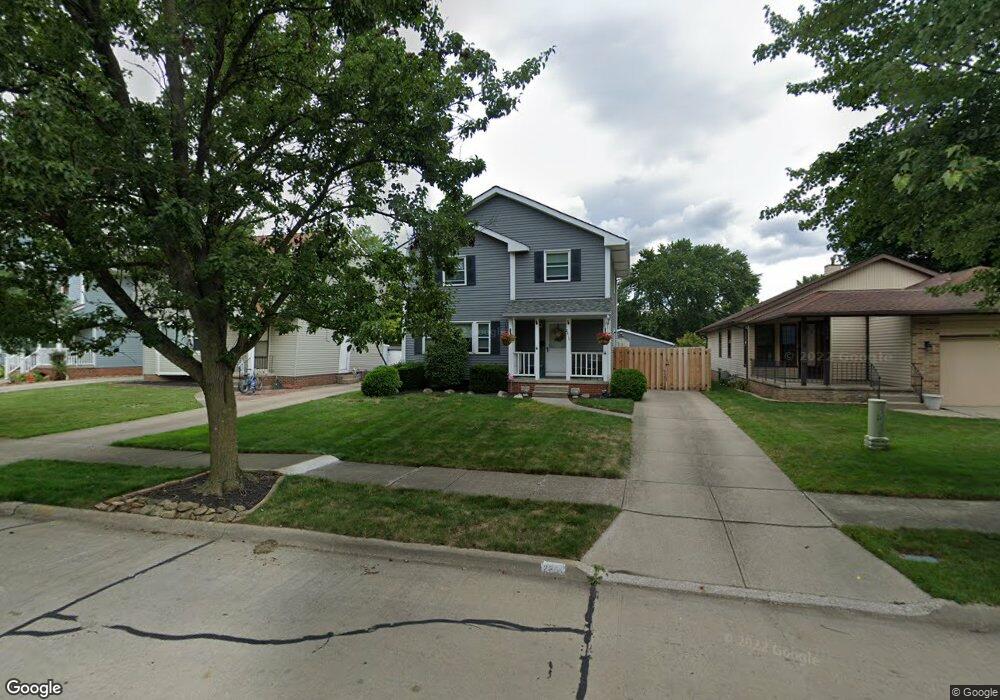
2810 George Ave Cleveland, OH 44134
Estimated Value: $192,000 - $255,000
3
Beds
2
Baths
1,544
Sq Ft
$147/Sq Ft
Est. Value
About This Home
This home is located at 2810 George Ave, Cleveland, OH 44134 and is currently estimated at $226,353, approximately $146 per square foot. 2810 George Ave is a home located in Cuyahoga County with nearby schools including Shiloh Middle School, John Muir Elementary School, and Parma High School.
Ownership History
Date
Name
Owned For
Owner Type
Purchase Details
Closed on
May 22, 1997
Sold by
Cunningham Christopher A
Bought by
Winters Floyd G and Frantz Denise L
Current Estimated Value
Home Financials for this Owner
Home Financials are based on the most recent Mortgage that was taken out on this home.
Original Mortgage
$111,000
Outstanding Balance
$15,519
Interest Rate
8.24%
Mortgage Type
New Conventional
Estimated Equity
$210,834
Purchase Details
Closed on
Dec 18, 1986
Bought by
Cunningham Christopher and Cunningham N
Purchase Details
Closed on
Oct 5, 1983
Sold by
Steinhoff Richard H
Bought by
Zaremba Bldg George Ave Co
Purchase Details
Closed on
Oct 13, 1982
Bought by
Steinhoff Richard H
Purchase Details
Closed on
Mar 25, 1981
Sold by
Emma G Steinhoff
Bought by
Union Commerce Bank Trustee
Purchase Details
Closed on
Jan 1, 1975
Bought by
Emma G Steinhoff
Create a Home Valuation Report for This Property
The Home Valuation Report is an in-depth analysis detailing your home's value as well as a comparison with similar homes in the area
Home Values in the Area
Average Home Value in this Area
Purchase History
| Date | Buyer | Sale Price | Title Company |
|---|---|---|---|
| Winters Floyd G | $130,700 | -- | |
| Cunningham Christopher | $83,100 | -- | |
| Zaremba Bldg George Ave Co | $8,300 | -- | |
| Steinhoff Richard H | -- | -- | |
| Union Commerce Bank Trustee | -- | -- | |
| Emma G Steinhoff | -- | -- |
Source: Public Records
Mortgage History
| Date | Status | Borrower | Loan Amount |
|---|---|---|---|
| Open | Winters Floyd G | $111,000 |
Source: Public Records
Tax History Compared to Growth
Tax History
| Year | Tax Paid | Tax Assessment Tax Assessment Total Assessment is a certain percentage of the fair market value that is determined by local assessors to be the total taxable value of land and additions on the property. | Land | Improvement |
|---|---|---|---|---|
| 2024 | $4,407 | $73,675 | $10,500 | $63,175 |
| 2023 | $3,913 | $56,140 | $12,110 | $44,030 |
| 2022 | $3,878 | $56,140 | $12,110 | $44,030 |
| 2021 | $3,993 | $56,140 | $12,110 | $44,030 |
| 2020 | $3,698 | $46,030 | $9,940 | $36,090 |
| 2019 | $3,553 | $131,500 | $28,400 | $103,100 |
| 2018 | $3,336 | $46,030 | $9,940 | $36,090 |
| 2017 | $3,266 | $39,100 | $5,320 | $33,780 |
| 2016 | $3,247 | $39,100 | $5,320 | $33,780 |
| 2015 | $3,311 | $39,100 | $5,320 | $33,780 |
| 2014 | $3,311 | $42,040 | $5,710 | $36,330 |
Source: Public Records
Map
Nearby Homes
- 2907 Liggett Dr
- 5850 S Park Blvd
- 3104 Liggett Dr
- 3214 Liggett Dr
- 2821 Parklane Dr
- 2829 Maplecrest Ave
- 3436 Heresford Dr
- 3019 Torrington Ave
- 2809 Wales Ave
- 2923 Brookdale Ave
- 2503 Brookdale Ave
- 4002 Maplecrest Ave
- 3910 Wood Ave
- 4005 Pershing Ave
- 4000 Pershing Ave
- 4424 Forestwood Dr
- 2010 Grantwood Dr
- 2302 Brookdale Ave
- 3319 Norris Ave
- 1319 Dartmoor Ave
- 2806 George Ave
- 2816 George Ave
- 2822 George Ave
- 2802 George Ave
- 2828 George Ave
- 2718 George Ave
- 2811 George Ave
- 2817 George Ave
- 2807 George Ave
- 2714 George Ave
- 2823 George Ave
- 2803 George Ave
- 2829 George
- 2829 George Ave
- 2719 George Ave
- 2708 George Ave
- 2902 George Ave
- 2715 George Ave
- 2704 George Ave
- 2709 George Ave