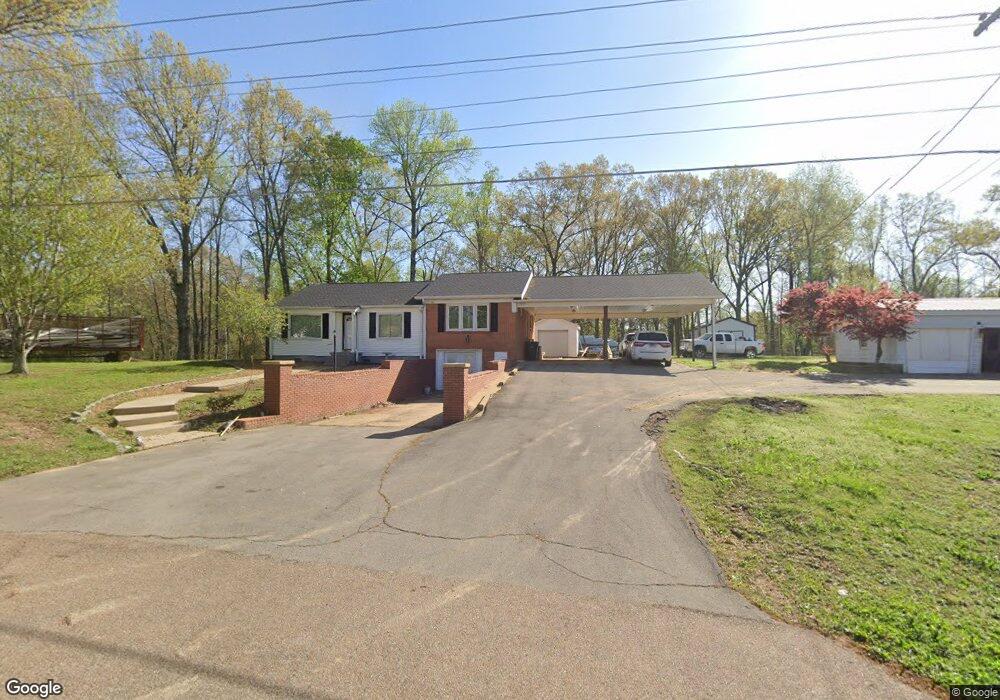
2810 Highway 69a Camden, TN 38320
Estimated Value: $168,000 - $254,000
--
Bed
2
Baths
1,488
Sq Ft
$143/Sq Ft
Est. Value
About This Home
This home is located at 2810 Highway 69a, Camden, TN 38320 and is currently estimated at $212,643, approximately $142 per square foot. 2810 Highway 69a is a home located in Benton County with nearby schools including Camden Elementary School, Briarwood School, and Camden Junior High School.
Ownership History
Date
Name
Owned For
Owner Type
Purchase Details
Closed on
Jan 2, 2024
Sold by
Oakley Victor
Bought by
Oakley Shane
Current Estimated Value
Purchase Details
Closed on
Jun 4, 2019
Sold by
Douglas Joseph David
Bought by
Oakley Brenda
Purchase Details
Closed on
Sep 28, 2015
Sold by
Jackson Sherrie Dian
Bought by
Douglas Joseph David
Purchase Details
Closed on
Mar 19, 2010
Sold by
Melton William Larry
Bought by
Jackson Dian
Purchase Details
Closed on
Aug 10, 2007
Sold by
Madden Andrea M
Bought by
Melton Judy
Purchase Details
Closed on
Sep 1, 1960
Bought by
Melton Horace
Purchase Details
Closed on
Jan 2, 1900
Create a Home Valuation Report for This Property
The Home Valuation Report is an in-depth analysis detailing your home's value as well as a comparison with similar homes in the area
Home Values in the Area
Average Home Value in this Area
Purchase History
| Date | Buyer | Sale Price | Title Company |
|---|---|---|---|
| Oakley Shane | -- | None Listed On Document | |
| Oakley Shane | -- | None Listed On Document | |
| Oakley Brenda | $130,000 | -- | |
| Douglas Joseph David | -- | -- | |
| Jackson Dian | -- | -- | |
| Melton Judy | $56,666 | -- | |
| Melton Horace | -- | -- | |
| -- | -- | -- |
Source: Public Records
Tax History Compared to Growth
Tax History
| Year | Tax Paid | Tax Assessment Tax Assessment Total Assessment is a certain percentage of the fair market value that is determined by local assessors to be the total taxable value of land and additions on the property. | Land | Improvement |
|---|---|---|---|---|
| 2025 | $849 | $46,550 | $0 | $0 |
| 2024 | $849 | $31,125 | $2,475 | $28,650 |
| 2023 | $849 | $31,125 | $2,475 | $28,650 |
| 2022 | $849 | $31,125 | $2,475 | $28,650 |
| 2021 | $849 | $31,125 | $2,475 | $28,650 |
| 2020 | $850 | $31,125 | $2,475 | $28,650 |
| 2019 | $749 | $25,375 | $2,475 | $22,900 |
| 2018 | $463 | $15,700 | $2,475 | $13,225 |
| 2017 | $463 | $15,700 | $2,475 | $13,225 |
| 2016 | $463 | $15,700 | $2,475 | $13,225 |
| 2015 | $463 | $15,700 | $2,475 | $13,225 |
| 2014 | $431 | $15,700 | $2,475 | $13,225 |
| 2013 | $431 | $14,655 | $0 | $0 |
Source: Public Records
Map
Nearby Homes
- 2250 Highway 69a
- 0 Longview St
- 0 Cedar Dr
- 000 Cedar Dr
- 00 Flatwoods Rd
- 0 Higdon Ck Rd Unit RTC2993447
- 130 Mimosa St
- 000 Laveta Ln
- 309 Asbury Rd
- 876 Flatwoods Rd
- 0 Asbury Rd
- 1762 Washington Ave
- 215 Woodside St
- 121 Davidson St
- 0 Forrest Ave N
- 0 George St
- 1 Post Oak Rd
- 186 N Forrest Ave
- 0 Hwy 641 N Unit 134811
- 0 Hwy 641 N Unit RTC2699308
- 2780 Highway 69a
- 2780 Old Highway 69
- 2785 Highway 69a
- 2847 Highway 69a
- 2715 Highway 69a
- 2875 Highway 69a
- 2905 Highway 69a
- 2905 Old Highway 69
- 2925 Highway 69a
- 2925 Tennessee 69a
- 2870 Highway 69a
- 2870 Old Highway 69
- 1286 McKelvy Rd
- 2955 Highway 69a
- 2980 Highway 69a
- 2585 Highway 69a
- 3005 Highway 69a
- 2535 Highway 69a
- 2440 Highway 641 N
- 1380 McKelvy Rd