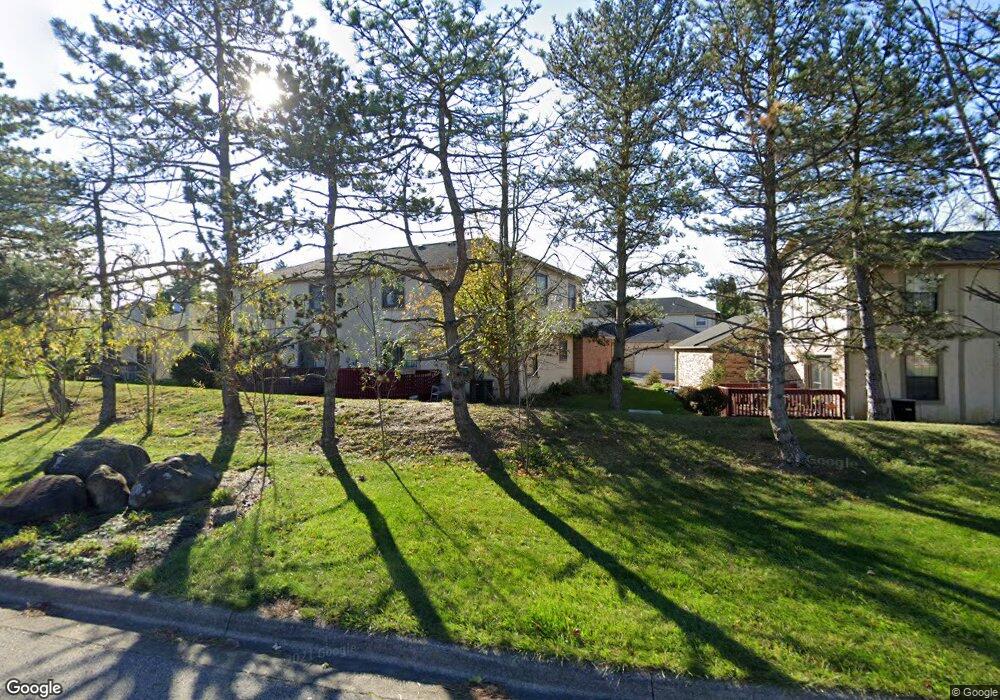
2810 Overview Ct Unit 2810 Columbus, OH 43231
Northern Woods NeighborhoodEstimated Value: $166,000 - $220,000
3
Beds
2
Baths
1,291
Sq Ft
$151/Sq Ft
Est. Value
About This Home
This home is located at 2810 Overview Ct Unit 2810, Columbus, OH 43231 and is currently estimated at $195,504, approximately $151 per square foot. 2810 Overview Ct Unit 2810 is a home located in Franklin County with nearby schools including Huber Ridge Elementary School, Walnut Springs Middle School, and Westerville Central High School.
Ownership History
Date
Name
Owned For
Owner Type
Purchase Details
Closed on
Jun 23, 2020
Sold by
Prichett Annellen
Bought by
Bllo Mohamed Mustafa and Kamel Lilas Mohammad
Current Estimated Value
Home Financials for this Owner
Home Financials are based on the most recent Mortgage that was taken out on this home.
Original Mortgage
$136,770
Outstanding Balance
$120,429
Interest Rate
3.2%
Mortgage Type
New Conventional
Estimated Equity
$75,075
Purchase Details
Closed on
Oct 27, 2000
Sold by
Rh Communities Venture I Llc
Bought by
Pritchett Annellen
Home Financials for this Owner
Home Financials are based on the most recent Mortgage that was taken out on this home.
Original Mortgage
$89,205
Interest Rate
7.9%
Purchase Details
Closed on
Feb 26, 1988
Purchase Details
Closed on
Jan 6, 1988
Create a Home Valuation Report for This Property
The Home Valuation Report is an in-depth analysis detailing your home's value as well as a comparison with similar homes in the area
Home Values in the Area
Average Home Value in this Area
Purchase History
| Date | Buyer | Sale Price | Title Company |
|---|---|---|---|
| Bllo Mohamed Mustafa | $141,000 | Search 2 Close | |
| Pritchett Annellen | $94,900 | -- | |
| -- | -- | -- | |
| -- | -- | -- |
Source: Public Records
Mortgage History
| Date | Status | Borrower | Loan Amount |
|---|---|---|---|
| Open | Bllo Mohamed Mustafa | $136,770 | |
| Previous Owner | Pritchett Annellen | $89,205 |
Source: Public Records
Tax History
| Year | Tax Paid | Tax Assessment Tax Assessment Total Assessment is a certain percentage of the fair market value that is determined by local assessors to be the total taxable value of land and additions on the property. | Land | Improvement |
|---|---|---|---|---|
| 2025 | $2,836 | $56,910 | $10,500 | $46,410 |
| 2024 | $2,836 | $56,910 | $10,500 | $46,410 |
| 2023 | $2,768 | $56,910 | $10,500 | $46,410 |
| 2022 | $2,513 | $39,450 | $5,460 | $33,990 |
| 2021 | $2,538 | $39,450 | $5,460 | $33,990 |
| 2020 | $1,941 | $39,030 | $5,460 | $33,570 |
| 2019 | $1,430 | $30,030 | $4,200 | $25,830 |
| 2018 | $1,644 | $30,030 | $4,200 | $25,830 |
| 2017 | $1,644 | $30,030 | $4,200 | $25,830 |
| 2016 | $1,886 | $34,870 | $5,220 | $29,650 |
| 2015 | $1,890 | $34,870 | $5,220 | $29,650 |
| 2014 | $1,892 | $34,870 | $5,220 | $29,650 |
| 2013 | $1,009 | $36,715 | $5,495 | $31,220 |
Source: Public Records
Map
Nearby Homes
- 2899 Granada Hills Dr
- 5685 Great Woods Blvd Unit 5685
- 3001 Cooper Bluff Dr Unit 3001
- 2623 Blendon Woods Blvd
- 3050 Cooper Bluff Dr
- 5562 Cartwright Ln Unit 13
- 3048 Highcliff Ct
- 3113 Highcliff Ct Unit 3113
- 2721 Woodland Trail Dr Unit 2721
- 3073 Birch Hollow Way Unit 3073
- 2713 Woodland Village Dr Unit 6
- 2470 Carolina Ave Unit 66
- 6142 Laurelwood Ct Unit 144
- 3194 Adirondack Ave
- 3137 Heron Pointe Unit 202
- 6200 Harbour Pointe Unit 301
- 2326 Laurelwood Dr Unit 2
- 6048 Pinemoor St
- 2292 Laurelwood Dr Unit 2292L
- 5730 Crossing Ct Unit 1
- 2812 Overview Ct Unit 2812
- 5809 Wendcliff Dr Unit 5809C
- 2809 Overview Ct Unit 2809B
- 2806 Overview Ct Unit 2806A
- 5811 Wendcliff Dr Unit 5811
- 2807 Overview Ct
- 2807 Overview Ct Unit 2807B
- 5805 Wendcliff Dr Unit 5805B
- 5803 Wendcliff Dr Unit 5801
- 2804 Overview Ct Unit 2804A
- 582 Lou St
- 5808 Wendcliff Dr Unit 5805A
- 5808 Wendcliff Dr Unit 5808A
- 5808 Wendcliff Dr Unit 5808A
- 2801 Overview Ct Unit B
- 5851 Mallview Ct
- 5851 Mall View Ct
- 2800 Overview Ct
- 5802 Wendcliff Dr Unit 5802
- 2803 Overview Ct Unit 2803B
Your Personal Tour Guide
Ask me questions while you tour the home.