Estimated Value: $577,785 - $640,000
4
Beds
4
Baths
3,730
Sq Ft
$164/Sq Ft
Est. Value
About This Home
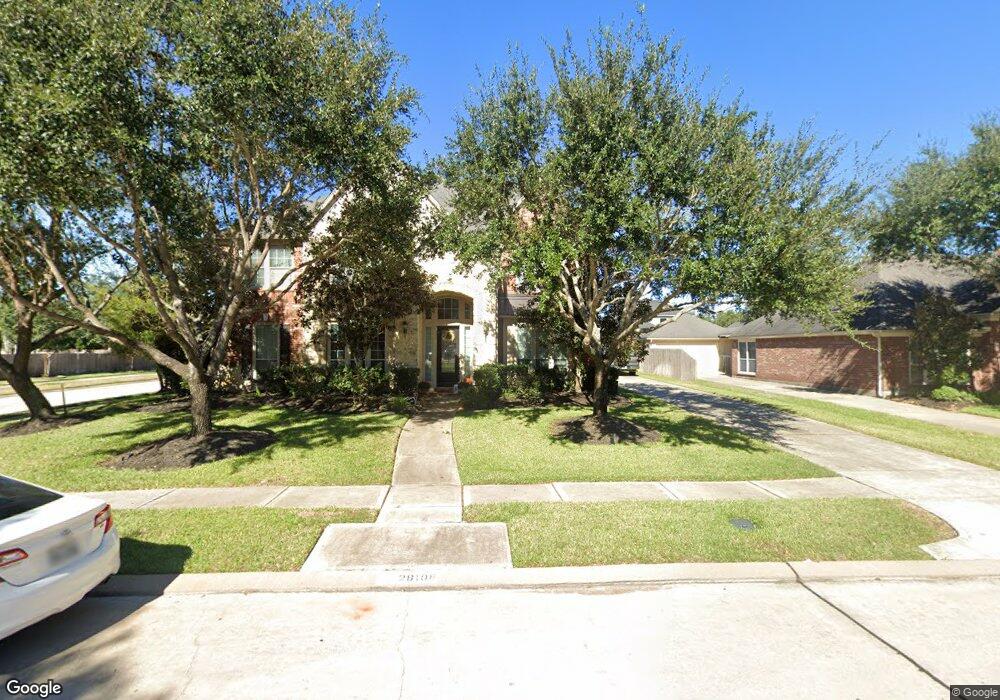
This home is located at 28106 Gadwall Dr, Katy, TX 77494 and is currently estimated at $613,196, approximately $164 per square foot. 28106 Gadwall Dr is a home located in Fort Bend County with nearby schools including Ray And Jamie Wolman Elementary School, Woodcreek Junior High School, and Katy High School.
Ownership History
Date
Name
Owned For
Owner Type
Purchase Details
Closed on
Apr 29, 2011
Sold by
Oconnell Elizabeth L
Bought by
Dodgen Bryan and Dodgen Dulce
Current Estimated Value
Home Financials for this Owner
Home Financials are based on the most recent Mortgage that was taken out on this home.
Original Mortgage
$297,255
Outstanding Balance
$206,007
Interest Rate
4.82%
Mortgage Type
New Conventional
Estimated Equity
$407,189
Purchase Details
Closed on
Jun 25, 2007
Sold by
Perry Homes
Bought by
Oconnell Elizabeth L
Home Financials for this Owner
Home Financials are based on the most recent Mortgage that was taken out on this home.
Original Mortgage
$230,900
Interest Rate
6.19%
Mortgage Type
Purchase Money Mortgage
Purchase Details
Closed on
Sep 29, 2006
Sold by
Jdc/Firethorne Ltd
Bought by
Perry Homes
Create a Home Valuation Report for This Property
The Home Valuation Report is an in-depth analysis detailing your home's value as well as a comparison with similar homes in the area
Home Values in the Area
Average Home Value in this Area
Purchase History
| Date | Buyer | Sale Price | Title Company |
|---|---|---|---|
| Dodgen Bryan | -- | Alamo Title 17 | |
| Oconnell Elizabeth L | -- | None Available | |
| Dodgen Bryan | -- | -- | |
| Perry Homes | -- | Chicago Title | |
| Dodgen Bryan | -- | -- |
Source: Public Records
Mortgage History
| Date | Status | Borrower | Loan Amount |
|---|---|---|---|
| Open | Dodgen Bryan | $297,255 | |
| Previous Owner | Dodgen Bryan | $230,900 |
Source: Public Records
Tax History Compared to Growth
Tax History
| Year | Tax Paid | Tax Assessment Tax Assessment Total Assessment is a certain percentage of the fair market value that is determined by local assessors to be the total taxable value of land and additions on the property. | Land | Improvement |
|---|---|---|---|---|
| 2025 | $9,871 | $540,866 | $100,100 | $443,953 |
| 2024 | $9,871 | $491,696 | $6,393 | $485,303 |
| 2023 | $9,119 | $446,996 | $0 | $490,795 |
| 2022 | $9,701 | $406,360 | $0 | $443,400 |
| 2021 | $9,954 | $369,420 | $77,000 | $292,420 |
| 2020 | $9,841 | $360,200 | $70,000 | $290,200 |
| 2019 | $9,938 | $339,120 | $67,250 | $271,870 |
| 2018 | $10,423 | $352,640 | $67,250 | $285,390 |
| 2017 | $10,152 | $339,470 | $67,250 | $272,220 |
| 2016 | $10,638 | $355,700 | $67,250 | $288,450 |
| 2015 | $5,782 | $323,360 | $67,250 | $256,110 |
| 2014 | $5,422 | $293,960 | $67,250 | $226,710 |
Source: Public Records
Map
Nearby Homes
- 28011 Buckthorn Dr
- 28219 Longspur Dr
- 2406 Brandyshire Dr
- 2302 Osprey Park Dr
- 28006 Everett Knolls Dr
- 28119 Rusty Hawthorne Dr
- 2531 Llano Springs Dr
- 2526 Llano Springs Dr
- 2218 Monarch Terrace Dr
- 28211 Crossprairie Dr
- 28523 Chesley Park Dr
- 28226 S Firethorne Rd
- 2018 Draycutt
- 2014 Draycutt Dr
- 28514 Hayden Park Dr
- 28230 Daystrom Ln
- 2506 Haven Hill Dr
- 2710 Carlson Manor Dr
- 27419 Gladway Manor Dr
- 2330 Brookdale Bend Dr
- 28102 Gadwall Dr
- 28107 Longspur Dr
- 28026 Gadwall Dr
- 28103 Longspur Dr
- 28110 Gadwall Dr
- 28023 Longspur Dr
- 28022 Gadwall Dr
- 28115 Longspur Dr
- 28107 Gadwall Dr
- 28114 Gadwall Dr
- 28111 Gadwall Dr
- 28019 Longspur Dr
- 28027 Gadwall Dr
- 28119 Longspur Dr
- 28018 Gadwall Dr
- 28115 Gadwall Dr
- 28106 Longspur Dr
- 28015 Longspur Dr
- 28118 Gadwall Dr
- 28023 Gadwall Dr