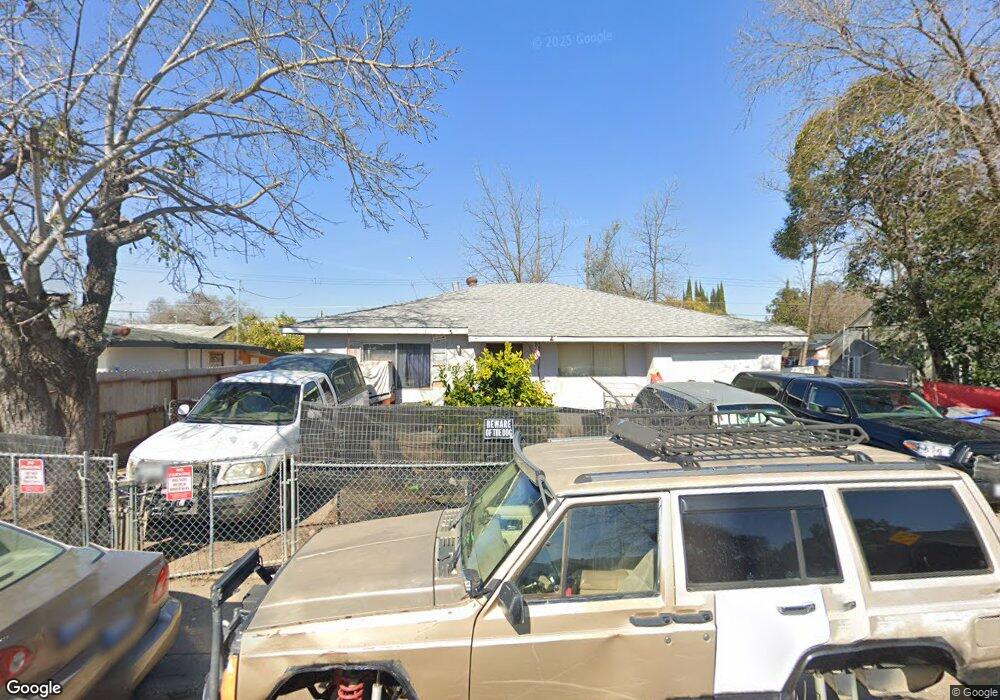
2811 34th Ave Sacramento, CA 95824
South City Farms NeighborhoodEstimated Value: $223,000 - $360,000
4
Beds
1
Bath
1,208
Sq Ft
$265/Sq Ft
Est. Value
About This Home
This home is located at 2811 34th Ave, Sacramento, CA 95824 and is currently estimated at $320,260, approximately $265 per square foot. 2811 34th Ave is a home located in Sacramento County with nearby schools including Ethel Phillips Elementary School, Rosa Parks Elementary School, and C. K. McClatchy High.
Ownership History
Date
Name
Owned For
Owner Type
Purchase Details
Closed on
Oct 4, 2019
Sold by
Treadway Frank James
Bought by
Treadway Frank James and The Frank James Treadway Livin
Current Estimated Value
Purchase Details
Closed on
Dec 6, 2010
Sold by
Eberhardt Adele Dorothy and The Bennie Mae Treadway Living
Bought by
Treadway Frank James
Purchase Details
Closed on
Jul 28, 2006
Sold by
Treadway Bennie Mae and The Bennie Mae Treadway Living
Bought by
Treadway Bennie Mae
Home Financials for this Owner
Home Financials are based on the most recent Mortgage that was taken out on this home.
Original Mortgage
$36,000
Interest Rate
6.69%
Mortgage Type
New Conventional
Purchase Details
Closed on
Jun 11, 1997
Sold by
Treadway Bennie Mae
Bought by
Bennie Mae Treadway Living Tr Agreement
Create a Home Valuation Report for This Property
The Home Valuation Report is an in-depth analysis detailing your home's value as well as a comparison with similar homes in the area
Home Values in the Area
Average Home Value in this Area
Purchase History
| Date | Buyer | Sale Price | Title Company |
|---|---|---|---|
| Treadway Frank James | -- | None Available | |
| Treadway Frank James | -- | None Available | |
| Treadway Bennie Mae | -- | Chicago Title Co | |
| Bennie Mae Treadway Living Tr Agreement | -- | -- |
Source: Public Records
Mortgage History
| Date | Status | Borrower | Loan Amount |
|---|---|---|---|
| Previous Owner | Treadway Bennie Mae | $36,000 |
Source: Public Records
Tax History
| Year | Tax Paid | Tax Assessment Tax Assessment Total Assessment is a certain percentage of the fair market value that is determined by local assessors to be the total taxable value of land and additions on the property. | Land | Improvement |
|---|---|---|---|---|
| 2025 | $1,280 | $93,186 | $20,695 | $72,491 |
| 2024 | $1,280 | $91,360 | $20,290 | $71,070 |
| 2023 | $1,250 | $89,570 | $19,893 | $69,677 |
| 2022 | $1,228 | $87,814 | $19,503 | $68,311 |
| 2021 | $1,173 | $86,093 | $19,121 | $66,972 |
| 2020 | $1,178 | $85,211 | $18,925 | $66,286 |
| 2019 | $1,075 | $83,541 | $18,554 | $64,987 |
| 2018 | $1,046 | $81,904 | $18,191 | $63,713 |
| 2017 | $1,029 | $80,299 | $17,835 | $62,464 |
| 2016 | $981 | $78,726 | $17,486 | $61,240 |
| 2015 | $965 | $77,545 | $17,224 | $60,321 |
| 2014 | $940 | $76,027 | $16,887 | $59,140 |
Source: Public Records
Map
Nearby Homes
- 3080 34th Ave
- 2740 29th Ave
- 3109 29th Ave
- 2525 Encinal Ave
- 2580 26th Ave
- 3450 27th Ave
- 3807 32nd Ave
- 3636 27th Ave
- 2325 Glen Ellen Cir
- 3721 40th Ave
- 6006 Martin Luther King Junior Blvd
- 3890 Fruitridge Rd
- 3341 23rd Ave
- 3712 42nd Ave
- 3620 24th Ave
- 5070 Martin Luther King Junior Blvd
- 2536 47th Ave
- 3433 22nd Ave
- 3743 23rd Ave
- 3711 46th Ave
Your Personal Tour Guide
Ask me questions while you tour the home.