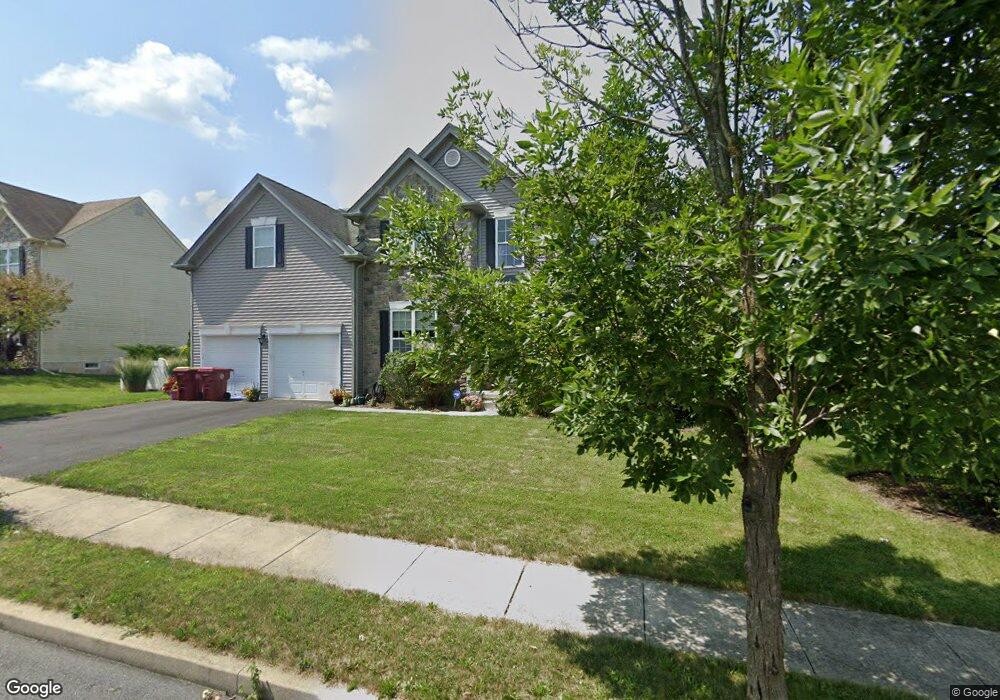
2811 Clark Place Unit Lot2 Easton, PA 18040
Estimated Value: $595,000 - $657,000
4
Beds
3
Baths
2,748
Sq Ft
$226/Sq Ft
Est. Value
About This Home
This home is located at 2811 Clark Place Unit Lot2, Easton, PA 18040 and is currently estimated at $620,883, approximately $225 per square foot. 2811 Clark Place Unit Lot2 is a home located in Northampton County with nearby schools including Shawnee Elementary School, Easton Area Middle School, and Easton Area High School.
Ownership History
Date
Name
Owned For
Owner Type
Purchase Details
Closed on
Dec 12, 2018
Sold by
Patel Dilesh
Bought by
Taylor Aponavicius Steven V and Taylor Aponavicius
Current Estimated Value
Home Financials for this Owner
Home Financials are based on the most recent Mortgage that was taken out on this home.
Original Mortgage
$280,000
Outstanding Balance
$247,178
Interest Rate
4.9%
Mortgage Type
New Conventional
Estimated Equity
$373,705
Purchase Details
Closed on
Mar 14, 2018
Sold by
Bank Of America Na
Bought by
Patel Dilesh
Purchase Details
Closed on
Mar 1, 2018
Sold by
Villalba Ubonel M and Molina Jadwiga
Bought by
Bank Of America N A
Purchase Details
Closed on
Apr 30, 2010
Sold by
Signature Homes
Bought by
Villalba Ubonel M and Molina Jadwiga
Home Financials for this Owner
Home Financials are based on the most recent Mortgage that was taken out on this home.
Original Mortgage
$365,262
Interest Rate
5.25%
Mortgage Type
FHA
Purchase Details
Closed on
Dec 8, 2008
Sold by
Red Rock Land Corporation
Bought by
Signature Homes and J T Maloney At Countryside Estates Lp
Create a Home Valuation Report for This Property
The Home Valuation Report is an in-depth analysis detailing your home's value as well as a comparison with similar homes in the area
Home Values in the Area
Average Home Value in this Area
Purchase History
| Date | Buyer | Sale Price | Title Company |
|---|---|---|---|
| Taylor Aponavicius Steven V | $350,000 | Southeastern Abstract Compan | |
| Patel Dilesh | $285,000 | None Available | |
| Bank Of America N A | $1,477 | None Available | |
| Villalba Ubonel M | $372,000 | None Available | |
| Signature Homes | $98,000 | None Available |
Source: Public Records
Mortgage History
| Date | Status | Borrower | Loan Amount |
|---|---|---|---|
| Open | Taylor Aponavicius Steven V | $280,000 | |
| Previous Owner | Villalba Ubonel M | $365,262 |
Source: Public Records
Tax History Compared to Growth
Tax History
| Year | Tax Paid | Tax Assessment Tax Assessment Total Assessment is a certain percentage of the fair market value that is determined by local assessors to be the total taxable value of land and additions on the property. | Land | Improvement |
|---|---|---|---|---|
| 2025 | $1,230 | $113,900 | $22,600 | $91,300 |
| 2024 | $9,980 | $113,900 | $22,600 | $91,300 |
| 2023 | $9,828 | $113,900 | $22,600 | $91,300 |
| 2022 | $9,679 | $113,900 | $22,600 | $91,300 |
| 2021 | $9,647 | $113,900 | $22,600 | $91,300 |
| 2020 | $9,642 | $113,900 | $22,600 | $91,300 |
| 2019 | $9,704 | $116,300 | $22,600 | $93,700 |
| 2018 | $9,538 | $116,300 | $22,600 | $93,700 |
| 2017 | $9,252 | $116,300 | $22,600 | $93,700 |
| 2016 | -- | $116,300 | $22,600 | $93,700 |
| 2015 | -- | $116,300 | $22,600 | $93,700 |
| 2014 | -- | $116,300 | $22,600 | $93,700 |
Source: Public Records
Map
Nearby Homes
- 2755 Destiny Ln
- 2665 Pond Dr
- 286 Park Ridge Dr
- 329 Knollwood Dr
- 311 Knollwood Dr
- 257 Park Ridge Dr
- 195 Park Ridge Dr
- 977 S Fork Dr
- 202 Park Ridge Dr
- 2567 Chestnut Ln
- 104 Winding Rd
- 107 Winding Rd
- 226 Winding Rd
- REGENT Plan at Lafayette Hills - Twins
- Derby Duplex Plan at Lafayette Hills - Twins
- 1300 Upstream Farm Rd
- 1325 Silo Dr
- PENWELL Plan at Lafayette Hills
- GALEN Plan at Lafayette Hills
- 2201 Huntington Ln
- 2811 Clark Place
- 2811 Clark Place Unit 2
- 2799 Clark Place
- 2799 Clark Place Unit 3
- 2823 Clark Place
- 2823 Clark Place Unit 1
- 2804 Milano Dr
- 2802 Milano Dr
- 2787 Clark Place
- 2787 Clark Place Unit 4
- 2796 Clark Place
- 2796 Clark Place Unit 13
- 2820 Clark Place Unit 11
- 2820 Clark Place
- 500 Adrian Dr
- 2800 Milano Dr
- 2784 Clark Place
- 2784 Clark Place Unit 14
- 2775 Clark Place
- 2775 Clark Place Unit 5