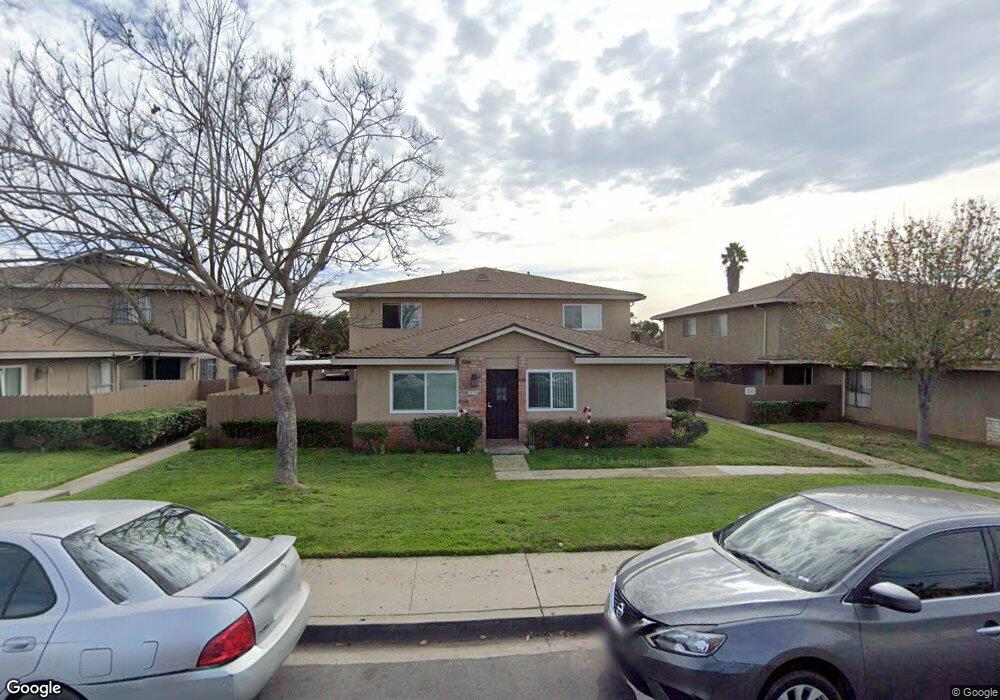
2811 Iris Ave Unit D San Ysidro, CA 92173
Otay Mesa West NeighborhoodEstimated Value: $411,000 - $431,000
2
Beds
1
Bath
819
Sq Ft
$517/Sq Ft
Est. Value
About This Home
This home is located at 2811 Iris Ave Unit D, San Ysidro, CA 92173 and is currently estimated at $423,656, approximately $517 per square foot. 2811 Iris Ave Unit D is a home located in San Diego County with nearby schools including Sunnyslope Elementary School, Southwest Middle School, and Southwest Senior High School.
Ownership History
Date
Name
Owned For
Owner Type
Purchase Details
Closed on
Sep 18, 2000
Sold by
Fregoso and Beronica
Bought by
Mcgonagill Brian and Mcgonagill Ramona M
Current Estimated Value
Home Financials for this Owner
Home Financials are based on the most recent Mortgage that was taken out on this home.
Original Mortgage
$90,250
Outstanding Balance
$32,823
Interest Rate
8.07%
Mortgage Type
Purchase Money Mortgage
Estimated Equity
$390,833
Purchase Details
Closed on
May 11, 1999
Sold by
Dickie Family Trust 07-18-92
Bought by
Fregoso Ricardo and Fregoso Beronica
Home Financials for this Owner
Home Financials are based on the most recent Mortgage that was taken out on this home.
Original Mortgage
$73,139
Interest Rate
6.84%
Mortgage Type
FHA
Purchase Details
Closed on
Feb 4, 1994
Sold by
Dickie Irving G and Dickie Virginia
Bought by
Dickie Irving G and Dickie Virginia
Create a Home Valuation Report for This Property
The Home Valuation Report is an in-depth analysis detailing your home's value as well as a comparison with similar homes in the area
Home Values in the Area
Average Home Value in this Area
Purchase History
| Date | Buyer | Sale Price | Title Company |
|---|---|---|---|
| Mcgonagill Brian | $95,000 | Lawyers Title | |
| Fregoso Ricardo | $75,000 | First American Title Ins Co | |
| Dickie Irving G | -- | -- |
Source: Public Records
Mortgage History
| Date | Status | Borrower | Loan Amount |
|---|---|---|---|
| Open | Mcgonagill Brian | $90,250 | |
| Previous Owner | Fregoso Ricardo | $73,139 |
Source: Public Records
Tax History
| Year | Tax Paid | Tax Assessment Tax Assessment Total Assessment is a certain percentage of the fair market value that is determined by local assessors to be the total taxable value of land and additions on the property. | Land | Improvement |
|---|---|---|---|---|
| 2025 | $1,582 | $143,122 | $57,322 | $85,800 |
| 2024 | $1,582 | $140,317 | $56,199 | $84,118 |
| 2023 | $1,568 | $137,567 | $55,098 | $82,469 |
| 2022 | $1,537 | $134,870 | $54,018 | $80,852 |
| 2021 | $1,488 | $132,226 | $52,959 | $79,267 |
| 2020 | $1,453 | $130,871 | $52,416 | $78,455 |
| 2019 | $1,451 | $128,306 | $51,389 | $76,917 |
| 2018 | $1,425 | $125,791 | $50,382 | $75,409 |
| 2017 | $1,394 | $123,326 | $49,395 | $73,931 |
| 2016 | $1,344 | $120,909 | $48,427 | $72,482 |
| 2015 | $1,341 | $119,094 | $47,700 | $71,394 |
| 2014 | $1,318 | $116,762 | $46,766 | $69,996 |
Source: Public Records
Map
Nearby Homes
- 2830 Terrace Pine Dr Unit C
- 2764 Terrace Pine Dr Unit C
- 1502-30 27th St
- 2888 Iris Ave Unit 84
- 2888 Iris Ave Unit 99
- 2950 Iris Ave Unit 48
- 2950 Iris Ave Unit 54
- 2950 Iris Ave Unit 33
- 3025 Iris Ave Unit B
- 1291 27th St
- 1205 27th St
- 1306 W San Ysidro Blvd Unit D
- 2531 Caminito Hiedra
- 1234 Caminito Cedro
- 1718 Meadowood Ct
- 2621 Alosta St
- 1323 Cornet Place
- 3268 Carnell Ave
- 2626 Coronado Ave Unit 118
- 2626 Coronado Ave Unit 45
- 2811 Iris Ave Unit C
- 2811 Iris Ave Unit A
- 2811 Iris Ave Unit B
- 2805 Iris Ave Unit A
- 2805 Iris Ave Unit C
- 2805 Iris Ave Unit D
- 2805 Iris Ave Unit B
- 2830 Terrace Pine Dr
- 2817 Iris Ave Unit D
- 2834 Terrace Pine Dr Unit D
- 2802 Terrace Pine Dr Unit C
- 2836 Terrace Pine Dr Unit A
- 2836 Terrace Pine Dr Unit B
- 2836 Terrace Pine Dr Unit D
- 2834 Terrace Pine Dr Unit B
- 2814 Terrace Pine Dr Unit C
- 2817 Iris Ave Unit A
- 2802 Terrace Pine Dr Unit A
- 2830 Terrace Pine Dr Unit A
- 2836 Terrace Pine Dr Unit C
Your Personal Tour Guide
Ask me questions while you tour the home.