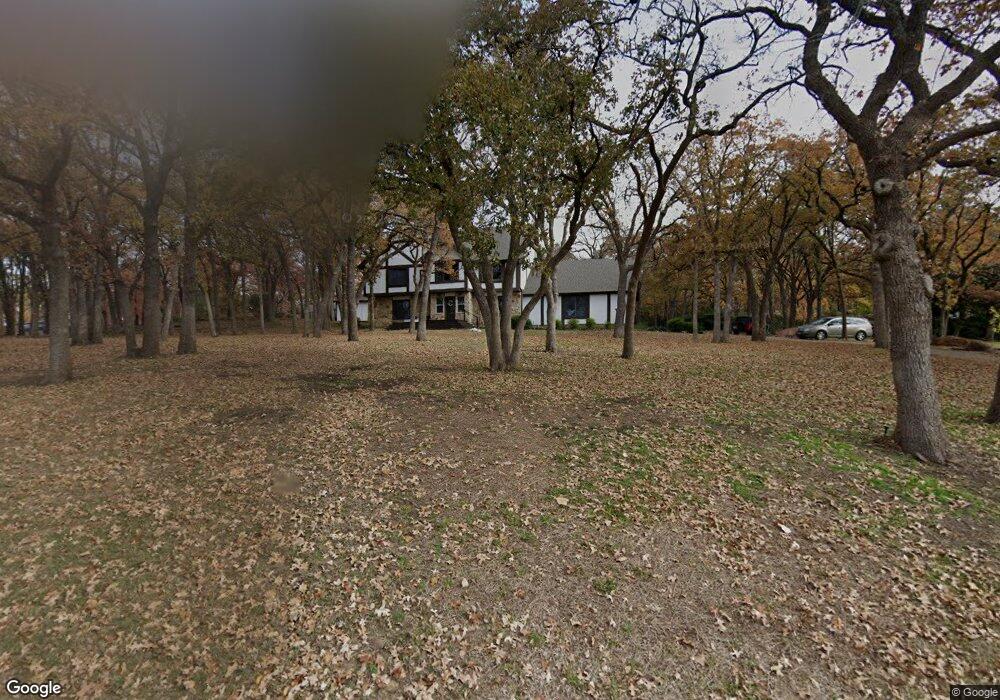
2811 Montecito Dr Denton, TX 76205
South Denton NeighborhoodEstimated Value: $425,000 - $636,570
3
Beds
3
Baths
2,782
Sq Ft
$206/Sq Ft
Est. Value
About This Home
This home is located at 2811 Montecito Dr, Denton, TX 76205 and is currently estimated at $573,893, approximately $206 per square foot. 2811 Montecito Dr is a home located in Denton County with nearby schools including Houston Elementary School, McMath Middle School, and Denton High School.
Ownership History
Date
Name
Owned For
Owner Type
Purchase Details
Closed on
Dec 26, 2018
Sold by
Richardson Peggy Ann
Bought by
Richardson Kayota Carolyn
Current Estimated Value
Home Financials for this Owner
Home Financials are based on the most recent Mortgage that was taken out on this home.
Original Mortgage
$216,000
Outstanding Balance
$190,313
Interest Rate
4.9%
Mortgage Type
New Conventional
Estimated Equity
$383,580
Purchase Details
Closed on
Dec 24, 2018
Sold by
Kayota Carolyn Richardson and The Peggy Ann Richardson Livin
Bought by
Cahill Bear and Cahill Monica R
Home Financials for this Owner
Home Financials are based on the most recent Mortgage that was taken out on this home.
Original Mortgage
$216,000
Outstanding Balance
$190,313
Interest Rate
4.9%
Mortgage Type
New Conventional
Estimated Equity
$383,580
Purchase Details
Closed on
Oct 3, 2007
Sold by
Tandy Ruth Elizabeth
Bought by
Tandy Ruth Elizabeth
Create a Home Valuation Report for This Property
The Home Valuation Report is an in-depth analysis detailing your home's value as well as a comparison with similar homes in the area
Home Values in the Area
Average Home Value in this Area
Purchase History
| Date | Buyer | Sale Price | Title Company |
|---|---|---|---|
| Richardson Kayota Carolyn | -- | Freedom Title | |
| Cahill Bear | -- | None Available | |
| Richardson Kayota Carolyn | -- | Freedom Title | |
| Tandy Ruth Elizabeth | -- | None Available | |
| Richardson Peggy Ann | -- | None Available |
Source: Public Records
Mortgage History
| Date | Status | Borrower | Loan Amount |
|---|---|---|---|
| Open | Cahill Bear | $216,000 |
Source: Public Records
Tax History Compared to Growth
Tax History
| Year | Tax Paid | Tax Assessment Tax Assessment Total Assessment is a certain percentage of the fair market value that is determined by local assessors to be the total taxable value of land and additions on the property. | Land | Improvement |
|---|---|---|---|---|
| 2025 | $10,119 | $494,000 | $216,094 | $277,906 |
| 2024 | $11,316 | $586,284 | $0 | $0 |
| 2023 | $8,977 | $532,985 | $216,094 | $446,099 |
| 2022 | $10,286 | $484,532 | $149,604 | $356,396 |
| 2021 | $8,750 | $393,615 | $104,722 | $288,893 |
| 2020 | $8,620 | $377,100 | $116,358 | $260,742 |
| 2019 | $8,590 | $360,000 | $116,358 | $243,642 |
| 2018 | $7,282 | $301,432 | $116,358 | $195,672 |
| 2017 | $6,773 | $274,029 | $79,791 | $194,238 |
| 2016 | $6,603 | $267,153 | $79,791 | $187,362 |
| 2015 | $4,961 | $259,093 | $79,791 | $179,302 |
| 2014 | $4,961 | $248,498 | $79,791 | $168,707 |
| 2013 | -- | $240,000 | $79,791 | $160,209 |
Source: Public Records
Map
Nearby Homes
- 816 Chapel Dr
- 824 Sandpiper Dr
- 821 Sandpiper Dr
- 3109 Forrestridge Dr
- 39 Highview Cir
- 829 Skylark Dr
- 1012 Indian Ridge Dr
- 2226 Savannah Trail
- 1000 Lynhurst Ln
- 1108 Ellison Park Cir
- 2216 Jefferson Trail
- 28 Timbergreen Cir
- 916 Smokerise Cir
- 720 Smokerise Cir
- 3601 Montecito Dr
- 9 Oak Forrest Cir
- 3612 Granada Trail
- 33 Oak Forrest Cir
- 2120 Fairfax Rd
- 2000 Lamprey Cir
- 2901 Montecito Dr
- 2801 Montecito Dr
- 2810 Carmel St
- 2800 Montecito Dr
- 2900 Carmel St
- 2800 Carmel St
- 2810 Montecito Dr
- 2911 Montecito Dr
- 2900 Montecito Dr
- 2910 Carmel St
- 2910 Montecito Dr
- 2801 Carmel St
- 2811 Carmel St
- 2901 Carmel St
- 3001 Montecito Dr
- 3001 Carmel St
- 3000 Montecito Dr
- 3000 Carmel St
- 836 Abbots Ln
- 832 Abbots Ln