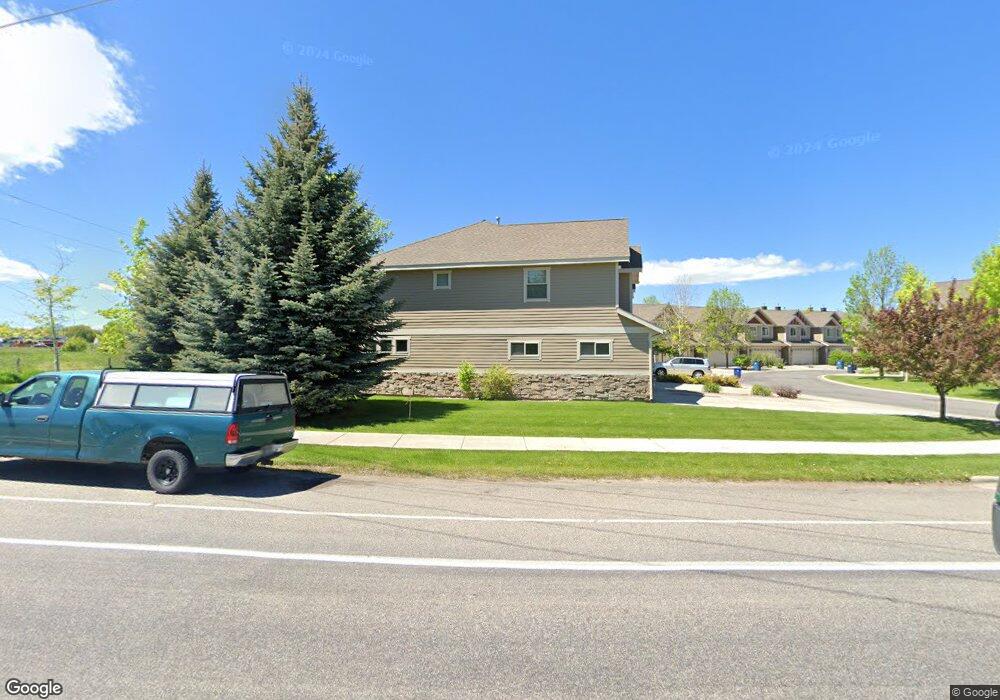
2811 N 27th Ave Bozeman, MT 59718
North Bozeman NeighborhoodEstimated Value: $470,366 - $484,000
3
Beds
3
Baths
1,645
Sq Ft
$290/Sq Ft
Est. Value
About This Home
This home is located at 2811 N 27th Ave, Bozeman, MT 59718 and is currently estimated at $477,122, approximately $290 per square foot. 2811 N 27th Ave is a home located in Gallatin County with nearby schools including Emily Dickinson School, Chief Joseph Middle School, and Bozeman High School.
Ownership History
Date
Name
Owned For
Owner Type
Purchase Details
Closed on
Jun 21, 2011
Sold by
Fannie Mae
Bought by
Innis Amanda
Current Estimated Value
Home Financials for this Owner
Home Financials are based on the most recent Mortgage that was taken out on this home.
Original Mortgage
$133,000
Interest Rate
4.56%
Mortgage Type
New Conventional
Purchase Details
Closed on
Nov 16, 2007
Sold by
Munter Travis L and Munter Kelly
Bought by
Notarius Aaron
Home Financials for this Owner
Home Financials are based on the most recent Mortgage that was taken out on this home.
Original Mortgage
$199,500
Interest Rate
6.35%
Mortgage Type
Purchase Money Mortgage
Purchase Details
Closed on
May 25, 2005
Sold by
Cooper Homes Llc
Bought by
Munter Travis L and Sprinkle Kelly
Home Financials for this Owner
Home Financials are based on the most recent Mortgage that was taken out on this home.
Original Mortgage
$175,655
Interest Rate
5.75%
Mortgage Type
New Conventional
Create a Home Valuation Report for This Property
The Home Valuation Report is an in-depth analysis detailing your home's value as well as a comparison with similar homes in the area
Home Values in the Area
Average Home Value in this Area
Purchase History
| Date | Buyer | Sale Price | Title Company |
|---|---|---|---|
| Innis Amanda | -- | First American Title Company | |
| Notarius Aaron | -- | Montana Title & Escrow | |
| Munter Travis L | -- | Stb |
Source: Public Records
Mortgage History
| Date | Status | Borrower | Loan Amount |
|---|---|---|---|
| Open | Innis Amanda | $133,000 | |
| Previous Owner | Notarius Aaron | $199,500 | |
| Previous Owner | Munter Travis L | $175,655 |
Source: Public Records
Tax History Compared to Growth
Tax History
| Year | Tax Paid | Tax Assessment Tax Assessment Total Assessment is a certain percentage of the fair market value that is determined by local assessors to be the total taxable value of land and additions on the property. | Land | Improvement |
|---|---|---|---|---|
| 2025 | $2,108 | $500,300 | $0 | $0 |
| 2024 | $3,007 | $451,800 | $0 | $0 |
| 2023 | $2,912 | $504,200 | $0 | $0 |
| 2022 | $2,297 | $299,600 | $0 | $0 |
| 2021 | $2,535 | $299,600 | $0 | $0 |
| 2020 | $2,132 | $249,200 | $0 | $0 |
| 2019 | $2,180 | $249,200 | $0 | $0 |
| 2018 | $1,909 | $202,100 | $0 | $0 |
| 2017 | $1,785 | $202,100 | $0 | $0 |
| 2016 | $1,598 | $169,000 | $0 | $0 |
| 2015 | $1,599 | $169,000 | $0 | $0 |
| 2014 | $1,756 | $109,286 | $0 | $0 |
Source: Public Records
Map
Nearby Homes
- 2926 Warbler Way Unit B
- Lots 14A & 15A Cattail St
- 2944 Warbler Way Unit A
- 2948 Warbler Way Unit C
- 2757 Marlyn Ct Unit 1
- 2963 Warbler Way Unit 4
- 2963 Warbler Way Unit 2
- 3123 Warbler Way Unit s A-D
- 3210 Warbler Way Unit 8
- 1109 & 1143 Thomas Dr
- 3095 Lori Ln
- 1242 Thomas Dr
- 3139 Blackbird Dr
- 2694 Typha Ct Unit 23
- 2720 Sartain St Unit 202
- 2855 Fen Way
- 2763 Catalyst St
- 2685 Typha Ct Unit 2
- 3321 N 27th Ave Unit 2
- 2621 Typha Ct
- 2811 N 27th Ave
- 2811 N 27th Ave
- 2811 N 27th Ave
- 2811 N 27th Ave
- 2811 N 27th Ave Unit 5
- 2811 N 27th#3
- 2827 N 27th Ave
- 2827 N 27th Ave
- 2827 N 27th Ave
- 2827 N 27th Ave
- 2827 N 27th Ave
- 2827 N 27th Ave Unit 3
- Lot 5 BLK 4 Cattail Creek
- 2845 N 27th Ave
- 2845 N 27th Ave
- 2845 N 27th Ave
- 2845 N 27th Ave
- 2863 N 27th Ave
- 2863 N 27th Ave
- 2863 N 27th Ave