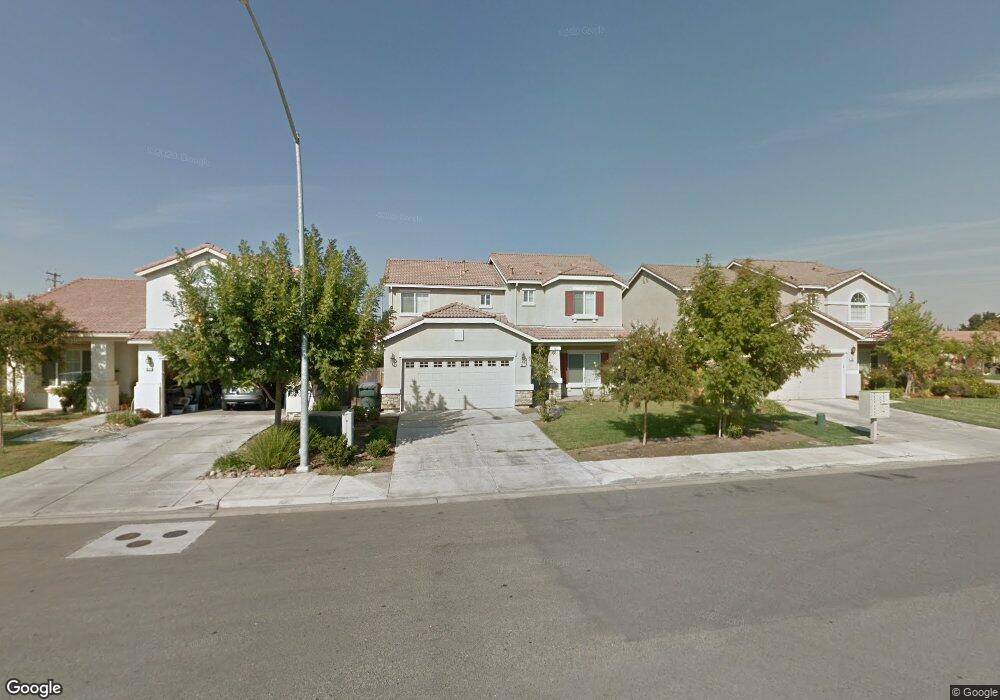
2811 Pear Tree Dr Madera, CA 93637
West Madera NeighborhoodEstimated Value: $384,000 - $502,000
4
Beds
3
Baths
2,171
Sq Ft
$210/Sq Ft
Est. Value
About This Home
This home is located at 2811 Pear Tree Dr, Madera, CA 93637 and is currently estimated at $455,850, approximately $209 per square foot. 2811 Pear Tree Dr is a home located in Madera County with nearby schools including Alpha Elementary School, Thomas Jefferson Middle School, and Madera South High School.
Ownership History
Date
Name
Owned For
Owner Type
Purchase Details
Closed on
Nov 17, 2012
Sold by
Kolb Pearl and Rivas Pearl
Bought by
Kolb Pearl
Current Estimated Value
Home Financials for this Owner
Home Financials are based on the most recent Mortgage that was taken out on this home.
Original Mortgage
$152,432
Outstanding Balance
$104,633
Interest Rate
3.25%
Mortgage Type
FHA
Estimated Equity
$351,217
Purchase Details
Closed on
Feb 1, 2010
Sold by
Maciel Bertha and Cardenas Jaime G
Bought by
Rivas Pearl
Home Financials for this Owner
Home Financials are based on the most recent Mortgage that was taken out on this home.
Original Mortgage
$157,102
Interest Rate
4.87%
Mortgage Type
FHA
Purchase Details
Closed on
Jan 30, 2007
Sold by
K Hovnanian Forecast Homes Inc
Bought by
Maciel Bertha and Cardenas Jaime G
Home Financials for this Owner
Home Financials are based on the most recent Mortgage that was taken out on this home.
Original Mortgage
$340,000
Interest Rate
6.11%
Mortgage Type
Purchase Money Mortgage
Create a Home Valuation Report for This Property
The Home Valuation Report is an in-depth analysis detailing your home's value as well as a comparison with similar homes in the area
Home Values in the Area
Average Home Value in this Area
Purchase History
| Date | Buyer | Sale Price | Title Company |
|---|---|---|---|
| Kolb Pearl | -- | Fatco | |
| Rivas Pearl | $160,000 | Fidelity National Title Co | |
| Maciel Bertha | $390,000 | Orange Coast Title Company |
Source: Public Records
Mortgage History
| Date | Status | Borrower | Loan Amount |
|---|---|---|---|
| Open | Kolb Pearl | $152,432 | |
| Closed | Rivas Pearl | $157,102 | |
| Previous Owner | Maciel Bertha | $340,000 |
Source: Public Records
Tax History
| Year | Tax Paid | Tax Assessment Tax Assessment Total Assessment is a certain percentage of the fair market value that is determined by local assessors to be the total taxable value of land and additions on the property. | Land | Improvement |
|---|---|---|---|---|
| 2025 | $2,429 | $206,514 | $77,441 | $129,073 |
| 2023 | $2,429 | $198,497 | $74,435 | $124,062 |
| 2022 | $2,192 | $194,606 | $72,976 | $121,630 |
| 2021 | $2,148 | $190,792 | $71,546 | $119,246 |
| 2020 | $2,184 | $188,837 | $70,813 | $118,024 |
| 2019 | $2,166 | $185,135 | $69,425 | $115,710 |
| 2018 | $1,997 | $181,506 | $68,064 | $113,442 |
| 2017 | $1,963 | $177,948 | $66,730 | $111,218 |
| 2016 | $1,913 | $174,460 | $65,422 | $109,038 |
| 2015 | $1,872 | $171,841 | $64,440 | $107,401 |
| 2014 | $1,747 | $168,476 | $63,178 | $105,298 |
Source: Public Records
Map
Nearby Homes
- 3108 Capistrano Dr
- 294 Double Tree Ct
- 3140 Capistrano Dr
- 242 Makenna Dr
- 23326 Avenue 13
- 125 S Granada Dr Unit 42
- 1207 Via Valencia
- 101 Mainberry Dr
- 3188 Winter Way
- 3124 Summer Ln
- 11 Seasons Ct
- 2428 W 3rd St
- 402 Mainberry Dr
- 418 S Creek Dr
- 24110 Avenue 14
- 14183 Road 24
- 99 Rosewood Cir
- 125 Queen Ln
- 3147 Boulder Ave
- 862 Bolinas Way
- 2821 Pear Tree Dr
- 2801 Pear Tree Dr
- 2831 Pear Tree Dr
- 2841 Pear Tree Dr
- 2800 Pear Tree Dr
- 1116 Peach Tree Dr
- 2790 Pear Tree Dr
- 1101 Lemon Tree Dr
- 1111 Lemon Tree Dr
- 2851 Pear Tree Dr
- 1122 Peach Tree Dr
- 1119 Lemon Tree Dr
- 1113 Hazelnut Ln
- 1127 Lemon Tree Dr
- 2803 Peanut Ct
- 2791 Peanut Ct
- 1119 Hazelnut Ln
- 1128 Peach Tree Dr
- 1108 S Berry Dr
- 1116 S Berry Dr
Your Personal Tour Guide
Ask me questions while you tour the home.