Estimated Value: $493,474 - $583,000
4
Beds
3
Baths
2,993
Sq Ft
$180/Sq Ft
Est. Value
About This Home
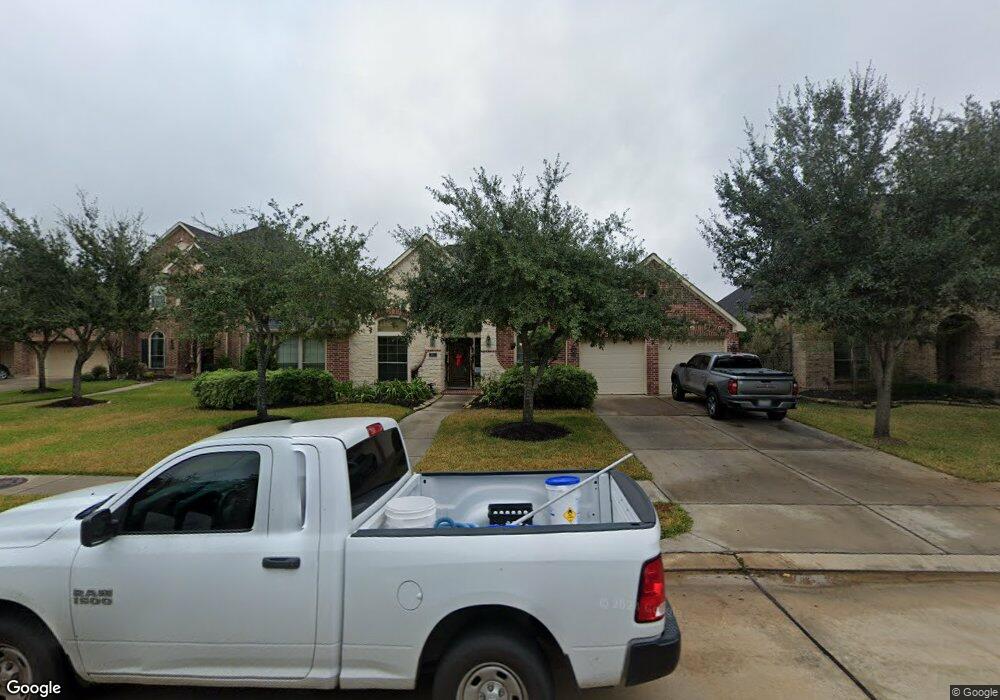
This home is located at 2811 Red Maple Dr, Katy, TX 77494 and is currently estimated at $539,119, approximately $180 per square foot. 2811 Red Maple Dr is a home located in Fort Bend County with nearby schools including Ray And Jamie Wolman Elementary School, Woodcreek Junior High School, and Katy High School.
Ownership History
Date
Name
Owned For
Owner Type
Purchase Details
Closed on
May 31, 2019
Sold by
Smith Larry R and Smith Terry M
Bought by
Green Robert K and Green Melissa Ann Gotte
Current Estimated Value
Home Financials for this Owner
Home Financials are based on the most recent Mortgage that was taken out on this home.
Original Mortgage
$252,000
Outstanding Balance
$221,570
Interest Rate
4.1%
Mortgage Type
New Conventional
Estimated Equity
$317,549
Purchase Details
Closed on
Dec 3, 2010
Sold by
Perry Homes Llc
Bought by
Smith Larry R and Smith Terry M
Home Financials for this Owner
Home Financials are based on the most recent Mortgage that was taken out on this home.
Original Mortgage
$292,108
Interest Rate
4.23%
Mortgage Type
New Conventional
Purchase Details
Closed on
Mar 19, 2010
Sold by
Jdc/Firethorne Ltd
Bought by
Perry Homes Llc
Create a Home Valuation Report for This Property
The Home Valuation Report is an in-depth analysis detailing your home's value as well as a comparison with similar homes in the area
Home Values in the Area
Average Home Value in this Area
Purchase History
| Date | Buyer | Sale Price | Title Company |
|---|---|---|---|
| Green Robert K | -- | None Available | |
| Smith Larry R | -- | Chicago Title | |
| Perry Homes Llc | -- | Chicago Title | |
| Smith Larry R | -- | -- |
Source: Public Records
Mortgage History
| Date | Status | Borrower | Loan Amount |
|---|---|---|---|
| Open | Green Robert K | $252,000 | |
| Previous Owner | Smith Larry R | $292,108 |
Source: Public Records
Tax History
| Year | Tax Paid | Tax Assessment Tax Assessment Total Assessment is a certain percentage of the fair market value that is determined by local assessors to be the total taxable value of land and additions on the property. | Land | Improvement |
|---|---|---|---|---|
| 2025 | $9,375 | $513,000 | $100,100 | $412,900 |
| 2024 | $9,375 | $469,528 | $57,604 | $411,924 |
| 2023 | $8,658 | $426,844 | $0 | $432,998 |
| 2022 | $9,240 | $388,040 | $6,200 | $381,840 |
| 2021 | $9,505 | $352,760 | $77,000 | $275,760 |
| 2020 | $9,290 | $340,040 | $70,000 | $270,040 |
| 2019 | $9,546 | $325,740 | $68,250 | $257,490 |
| 2018 | $10,047 | $339,930 | $68,250 | $271,680 |
| 2017 | $9,985 | $333,880 | $68,250 | $265,630 |
| 2016 | $10,739 | $359,090 | $68,250 | $290,840 |
| 2015 | $4,818 | $362,960 | $68,250 | $294,710 |
| 2014 | $4,856 | $329,960 | $68,250 | $261,710 |
Source: Public Records
Map
Nearby Homes
- 2818 Red Maple Dr
- 2822 Snow Finch Ct
- 28814 Davenport Dr
- 28902 Davenport Dr
- 28915 Davenport Dr
- 28514 Rock Wren Ct
- 28919 Crested Butte Dr
- 2907 Isla Gorge Ct
- 28514 Blue Holly Ln
- 2718 Misty Laurel Ct
- 29018 Pinnacle Ridge Dr
- 2922 Isla Gorge Ct
- 28507 Spiceberry Dr
- 2919 Iron Range Ct
- 2506 Foxcrest Dr
- 29011 Erica Lee Ct
- 28406 Spiceberry Dr
- 28514 Eli Eagle St
- 2931 Mcdonough Way
- 2815 Weldons Forest Dr
- 2815 Red Maple Dr
- 2807 Red Maple Dr
- 2818 Snow Finch Ct
- 2814 Snow Finch Ct
- 2819 Red Maple Dr
- 2810 Snow Finch Ct
- 2803 Red Maple Dr
- 2814 Red Maple Dr
- 2823 Red Maple Dr
- 2810 Red Maple Dr
- 2802 Red Maple Dr
- 2826 Red Maple Dr
- 2822 Red Maple Dr
- 2826 Snow Finch Ct
- 2806 Snow Finch Ct
- 2806 Red Maple Dr
- 2282 Snow Finch Ct
- 2815 Snow Finch Ct
- 2811 Snow Finch Ct
- 2819 Snow Finch Ct
Your Personal Tour Guide
Ask me questions while you tour the home.