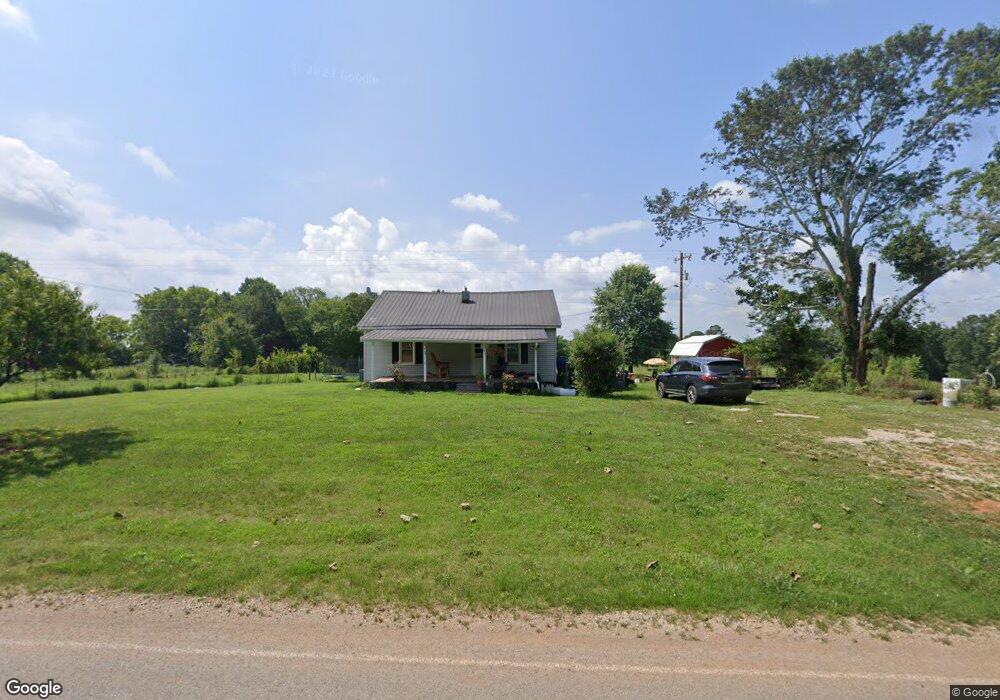
2811 Rhea Branch Rd Ethridge, TN 38456
Estimated Value: $138,000 - $303,000
--
Bed
1
Bath
1,139
Sq Ft
$194/Sq Ft
Est. Value
About This Home
This home is located at 2811 Rhea Branch Rd, Ethridge, TN 38456 and is currently estimated at $221,428, approximately $194 per square foot. 2811 Rhea Branch Rd is a home located in Giles County with nearby schools including Richland Elementary School and Richland School.
Ownership History
Date
Name
Owned For
Owner Type
Purchase Details
Closed on
Nov 16, 2009
Sold by
Deutsche Bank National Tru
Bought by
Thompson James D
Current Estimated Value
Purchase Details
Closed on
Jul 3, 2006
Sold by
Fralix Joe F
Bought by
Dickey Lacy
Home Financials for this Owner
Home Financials are based on the most recent Mortgage that was taken out on this home.
Original Mortgage
$67,200
Interest Rate
6.6%
Purchase Details
Closed on
Feb 1, 2006
Sold by
Putnam Phillip Keith
Bought by
Fralix Joe F
Purchase Details
Closed on
Aug 23, 2001
Sold by
Fralix Joe F and Fralix Frances A
Bought by
Putnam Phillip K and Putnam Cindy
Home Financials for this Owner
Home Financials are based on the most recent Mortgage that was taken out on this home.
Original Mortgage
$55,300
Interest Rate
7.02%
Purchase Details
Closed on
Nov 19, 1991
Bought by
Fralix Joe F and Fralix Frances A
Purchase Details
Closed on
Mar 7, 1980
Bought by
Walsh Janie Ussery Etvir Eddie
Create a Home Valuation Report for This Property
The Home Valuation Report is an in-depth analysis detailing your home's value as well as a comparison with similar homes in the area
Home Values in the Area
Average Home Value in this Area
Purchase History
| Date | Buyer | Sale Price | Title Company |
|---|---|---|---|
| Thompson James D | $30,900 | -- | |
| Dickey Lacy | $84,000 | -- | |
| Fralix Joe F | $61,000 | -- | |
| Putnam Phillip K | $55,300 | -- | |
| Fralix Joe F | -- | -- | |
| Walsh Janie Ussery Etvir Eddie | -- | -- |
Source: Public Records
Mortgage History
| Date | Status | Borrower | Loan Amount |
|---|---|---|---|
| Previous Owner | Walsh Janie Ussery Etvir Eddie | $67,200 | |
| Previous Owner | Walsh Janie Ussery Etvir Eddie | $55,300 |
Source: Public Records
Tax History Compared to Growth
Tax History
| Year | Tax Paid | Tax Assessment Tax Assessment Total Assessment is a certain percentage of the fair market value that is determined by local assessors to be the total taxable value of land and additions on the property. | Land | Improvement |
|---|---|---|---|---|
| 2024 | $681 | $34,300 | $15,750 | $18,550 |
| 2023 | $681 | $34,300 | $15,750 | $18,550 |
| 2022 | $681 | $34,300 | $15,750 | $18,550 |
| 2021 | $588 | $20,825 | $11,200 | $9,625 |
| 2020 | $588 | $20,825 | $11,200 | $9,625 |
| 2019 | $588 | $20,825 | $11,200 | $9,625 |
| 2018 | $588 | $20,825 | $11,200 | $9,625 |
| 2017 | $588 | $20,825 | $11,200 | $9,625 |
| 2016 | $495 | $16,650 | $6,850 | $9,800 |
| 2015 | $461 | $16,650 | $6,850 | $9,800 |
| 2014 | $462 | $16,662 | $0 | $0 |
Source: Public Records
Map
Nearby Homes
- 2338 Rhea Branch Rd
- 2310 Rhea Branch Rd
- 2346 Rhea Branch Rd
- 3812 Rhea Branch Rd
- 2270 Schuler Branch Rd
- 2270 Shuler Branch Rd
- 1344 Cut Off Rd
- 492 Campbellsville Pike
- 9718 Campbellsville Rd
- 9706 Campbellsville Rd
- 9716 Campbellsville Rd
- 9710 Campbellsville Rd
- 13546 Campbellsville Rd
- 13581 Campbellsville Rd
- 0 Powdermill Bridge Rd
- 14035 Campbellsville Rd
- 14256 Campbellsville Rd
- 1277 Campbellsville Pike
- 0 Weakley Loop
- 5712 Little Dry Creek Rd
- 2769 Rhea Branch Rd
- 2769 Rhea Branch Rd
- 2981 Rhea Branch Rd
- 2773 Rhea Branch Rd
- 2773 Rhea Branch Rd
- 160 Casteel Rd
- 160 Casteel Rd
- 00 Shuler Branch Rd
- 0 Shuler Branch Rd
- 3065 Rhea Branch Rd
- 197 Casteel Rd
- 161 Casteel Rd
- 141 Casteel Rd
- 2531 Rhea Branch Rd
- 2531 Rhea Branch
- 3269 Shuler Branch Rd
- 323 Casteel Rd
- 219 Casteel Rd
- 3174 Rhea Branch Rd
- 458 Dickey Rd