Estimated Value: $383,000 - $394,000
3
Beds
2
Baths
2,193
Sq Ft
$178/Sq Ft
Est. Value
About This Home
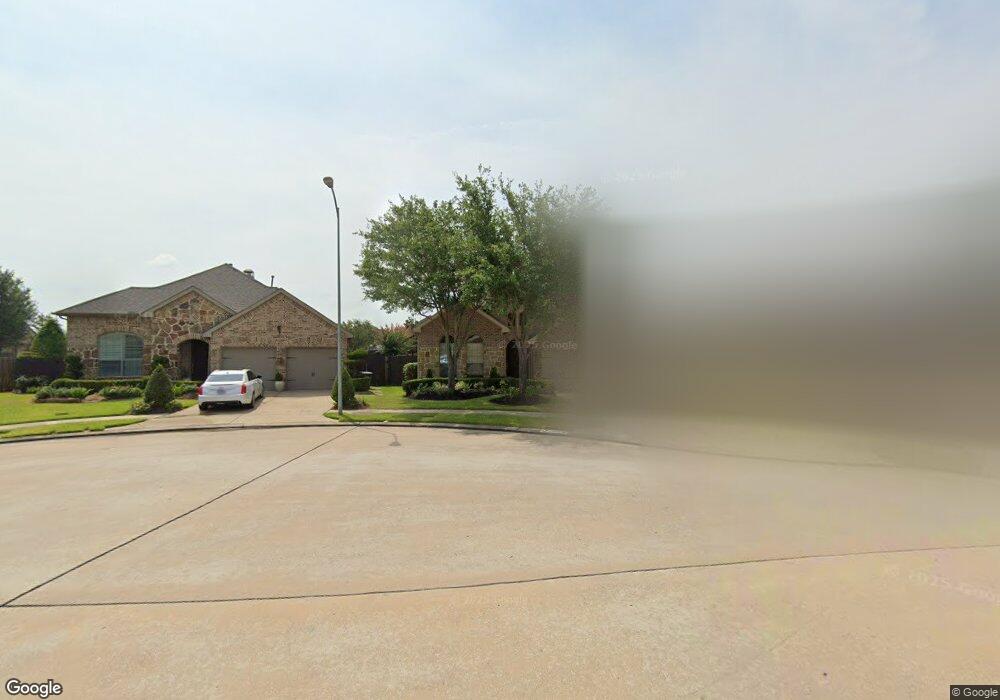
This home is located at 28115 Chalet Park Dr, Katy, TX 77494 and is currently estimated at $390,348, approximately $177 per square foot. 28115 Chalet Park Dr is a home located in Fort Bend County with nearby schools including Ray And Jamie Wolman Elementary School, Woodcreek Junior High School, and Katy High School.
Ownership History
Date
Name
Owned For
Owner Type
Purchase Details
Closed on
Mar 3, 2017
Sold by
Sylvester Andy A and Sylvester Suzanne
Bought by
Smith Glenn X and Smith Jo Ann
Current Estimated Value
Home Financials for this Owner
Home Financials are based on the most recent Mortgage that was taken out on this home.
Original Mortgage
$192,000
Outstanding Balance
$158,861
Interest Rate
4.09%
Estimated Equity
$231,487
Purchase Details
Closed on
Mar 29, 2010
Sold by
Highland Homes Houston Ltd
Bought by
Sylvester Andy A and Sylvester Suzanne
Home Financials for this Owner
Home Financials are based on the most recent Mortgage that was taken out on this home.
Original Mortgage
$157,600
Interest Rate
5%
Mortgage Type
New Conventional
Purchase Details
Closed on
Aug 20, 2009
Sold by
Jdc/Firethorne Ltd
Bought by
Highland Homes & Houston Ltd
Create a Home Valuation Report for This Property
The Home Valuation Report is an in-depth analysis detailing your home's value as well as a comparison with similar homes in the area
Home Values in the Area
Average Home Value in this Area
Purchase History
| Date | Buyer | Sale Price | Title Company |
|---|---|---|---|
| Smith Glenn X | -- | None Available | |
| Sylvester Andy A | -- | Old Republic National Title | |
| Smith Glenn X | -- | -- | |
| Highland Homes & Houston Ltd | -- | Reunion Title | |
| Smith Glenn X | -- | -- |
Source: Public Records
Mortgage History
| Date | Status | Borrower | Loan Amount |
|---|---|---|---|
| Open | Smith Glenn X | $192,000 | |
| Previous Owner | Smith Glenn X | $157,600 |
Source: Public Records
Tax History Compared to Growth
Tax History
| Year | Tax Paid | Tax Assessment Tax Assessment Total Assessment is a certain percentage of the fair market value that is determined by local assessors to be the total taxable value of land and additions on the property. | Land | Improvement |
|---|---|---|---|---|
| 2025 | $4,002 | $388,359 | $67,246 | $337,327 |
| 2024 | $4,002 | $353,054 | $4,724 | $348,330 |
| 2023 | $4,002 | $320,958 | $0 | $353,070 |
| 2022 | $5,430 | $291,780 | $0 | $308,850 |
| 2021 | $7,147 | $265,250 | $47,030 | $218,220 |
| 2020 | $6,881 | $251,860 | $42,750 | $209,110 |
| 2019 | $7,378 | $251,750 | $39,900 | $211,850 |
| 2018 | $7,290 | $246,660 | $39,900 | $206,760 |
| 2017 | $7,330 | $245,110 | $39,900 | $205,210 |
| 2016 | $7,662 | $256,190 | $39,900 | $216,290 |
| 2015 | $4,224 | $241,560 | $39,900 | $201,660 |
| 2014 | $3,993 | $219,600 | $39,900 | $179,700 |
Source: Public Records
Map
Nearby Homes
- 28210 Chalet Park Dr
- 2802 Helding Park Ct
- 28230 Daystrom Ln
- 2827 Fair Chase Dr
- 2714 Ember Pass Ln
- 28211 Crossprairie Dr
- 2943 Fair Chase Dr
- 28226 S Firethorne Rd
- 2914 Legend Hill Dr
- 28302 Hazel Trail
- 2710 Indigo Manor Ln
- 28407 Kinglet Pines Dr
- 27915 Genesis Manor Ln
- 28119 Rusty Hawthorne Dr
- 2531 Llano Springs Dr
- 2526 Llano Springs Dr
- 28434 Eli Eagle St
- 27715 Oasis Ridge Dr
- 2938 Bobby Jones Rd
- 27711 Oasis Ridge Dr
- 28119 Chalet Park Dr
- 28111 Chalet Park Dr
- 28114 Chalet Park Dr
- 28126 Helmsman Knolls Dr
- 28130 Helmsman Knolls Dr
- 28122 Helmsman Knolls Dr
- 28107 Chalet Park Dr
- 28203 Chalet Park Dr
- 28118 Chalet Park Dr
- 28103 Chalet Park Dr
- 28110 Chalet Park Dr
- 28202 Chalet Park Dr
- 28114 Helmsman Knolls Dr
- 28207 Chalet Park Dr
- 28206 Chalet Park Dr
- 28106 Chalet Park Dr
- 28110 Helmsman Knolls Dr
- 28118 Helmsman Knolls Dr
- 28211 Chalet Park Dr
- 28202 Helmsman Knolls Dr