Estimated Value: $478,000 - $517,885
4
Beds
3
Baths
3,167
Sq Ft
$159/Sq Ft
Est. Value
About This Home
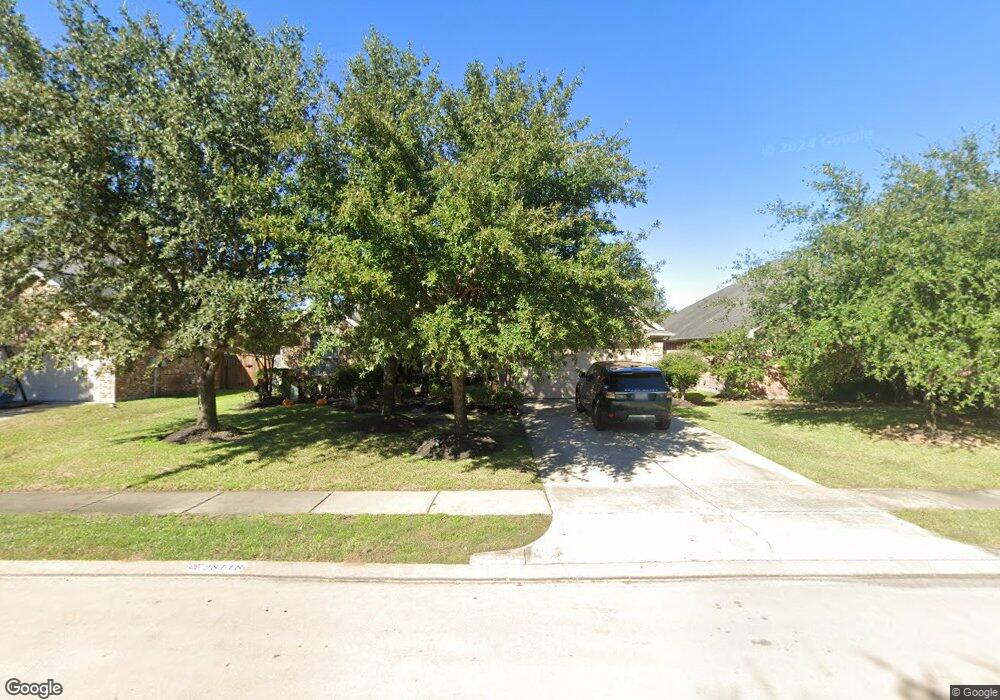
This home is located at 28118 Rusty Hawthorne Dr, Katy, TX 77494 and is currently estimated at $501,971, approximately $158 per square foot. 28118 Rusty Hawthorne Dr is a home located in Fort Bend County with nearby schools including Ray And Jamie Wolman Elementary School, Woodcreek Junior High School, and Katy High School.
Ownership History
Date
Name
Owned For
Owner Type
Purchase Details
Closed on
Aug 12, 2014
Sold by
Henson Patricia L Hyatt and Henson Patricia L
Bought by
Henson Patricia L Hyatt
Current Estimated Value
Home Financials for this Owner
Home Financials are based on the most recent Mortgage that was taken out on this home.
Original Mortgage
$171,620
Interest Rate
4.1%
Mortgage Type
New Conventional
Purchase Details
Closed on
May 8, 2007
Sold by
David Weekley Homes Lp
Bought by
Henson Patricia L
Home Financials for this Owner
Home Financials are based on the most recent Mortgage that was taken out on this home.
Original Mortgage
$207,700
Interest Rate
6.13%
Mortgage Type
Purchase Money Mortgage
Purchase Details
Closed on
Mar 31, 2006
Sold by
Jdc / Firethorne Ltd
Bought by
Henson Patricia L Haytt
Create a Home Valuation Report for This Property
The Home Valuation Report is an in-depth analysis detailing your home's value as well as a comparison with similar homes in the area
Home Values in the Area
Average Home Value in this Area
Purchase History
| Date | Buyer | Sale Price | Title Company |
|---|---|---|---|
| Henson Patricia L Hyatt | -- | Chicago Title Insurance Co | |
| Henson Patricia L | -- | Priority Title Co | |
| Henson Patricia L Haytt | -- | -- |
Source: Public Records
Mortgage History
| Date | Status | Borrower | Loan Amount |
|---|---|---|---|
| Previous Owner | Henson Patricia L Hyatt | $171,620 | |
| Previous Owner | Henson Patricia L | $207,700 |
Source: Public Records
Tax History Compared to Growth
Tax History
| Year | Tax Paid | Tax Assessment Tax Assessment Total Assessment is a certain percentage of the fair market value that is determined by local assessors to be the total taxable value of land and additions on the property. | Land | Improvement |
|---|---|---|---|---|
| 2025 | $7,989 | $485,949 | $67,600 | $418,349 |
| 2024 | $7,989 | $464,434 | $2,201 | $462,233 |
| 2023 | $8,551 | $422,213 | $0 | $468,693 |
| 2022 | $9,134 | $383,830 | $0 | $418,720 |
| 2021 | $9,402 | $348,940 | $52,000 | $296,940 |
| 2020 | $9,147 | $334,800 | $52,000 | $282,800 |
| 2019 | $9,530 | $325,190 | $50,000 | $275,190 |
| 2018 | $9,509 | $321,730 | $50,000 | $271,730 |
| 2017 | $9,592 | $320,750 | $50,000 | $270,750 |
| 2016 | $10,194 | $340,870 | $50,000 | $290,870 |
| 2015 | $6,627 | $330,940 | $50,000 | $280,940 |
| 2014 | $5,882 | $290,990 | $50,000 | $240,990 |
Source: Public Records
Map
Nearby Homes
- 28119 Rusty Hawthorne Dr
- 2531 Llano Springs Dr
- 2526 Llano Springs Dr
- 28006 Everett Knolls Dr
- 28211 Crossprairie Dr
- 28219 Longspur Dr
- 28226 S Firethorne Rd
- 2406 Brandyshire Dr
- 28230 Daystrom Ln
- 2302 Osprey Park Dr
- 28011 Buckthorn Dr
- 28523 Chesley Park Dr
- 2802 Helding Park Ct
- 28514 Hayden Park Dr
- 2835 Chalet Knolls Ln
- 2218 Monarch Terrace Dr
- 28514 Blue Holly Ln
- 2827 Fair Chase Dr
- 28210 Chalet Park Dr
- 2710 Carlson Manor Dr
- 28114 Rusty Hawthorne Dr
- 28122 Rusty Hawthorne Dr
- 28110 Rusty Hawthorne Dr
- 28127 Everett Knolls Dr
- 28123 Everett Knolls Dr
- 28119 Everett Knolls Dr
- 28126 Rusty Hawthorne Dr
- 28131 Everett Knolls Dr
- 28115 Everett Knolls Dr
- 2507 Firecrest Dr
- 28106 Rusty Hawthorne Dr
- 28115 Rusty Hawthorne Dr
- 28135 Everett Knolls Dr
- 28111 Everett Knolls Dr
- 28111 Rusty Hawthorne Dr
- 2502 Firecrest Dr
- 28203 Everett Knolls Dr
- 2511 Firecrest Dr
- 28102 Rusty Hawthorne Dr
- 28107 Everett Knolls Dr