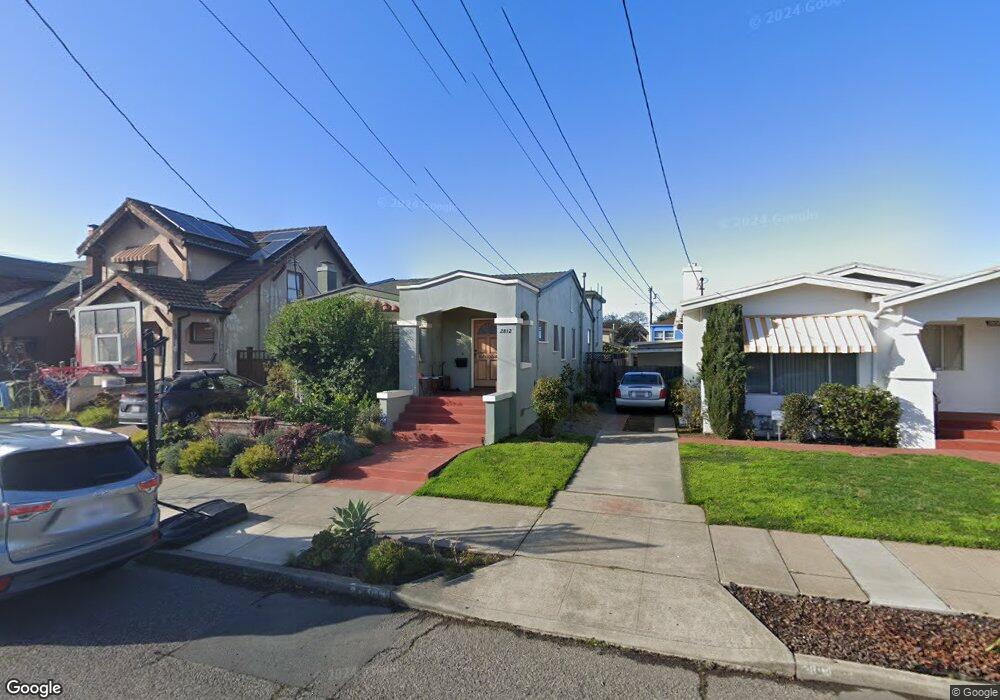
2812 Dohr St Berkeley, CA 94702
West Berkeley NeighborhoodEstimated Value: $1,377,098 - $1,634,000
3
Beds
3
Baths
1,446
Sq Ft
$1,018/Sq Ft
Est. Value
About This Home
This home is located at 2812 Dohr St, Berkeley, CA 94702 and is currently estimated at $1,471,775, approximately $1,017 per square foot. 2812 Dohr St is a home located in Alameda County with nearby schools including Malcolm X Elementary School, Washington Elementary School, and Oxford Elementary School.
Ownership History
Date
Name
Owned For
Owner Type
Purchase Details
Closed on
Mar 24, 2023
Sold by
Fenyves Lee and Fenyves Laina
Bought by
Laina Marian Adler And Lee Fenyves Revocable and Adler
Current Estimated Value
Purchase Details
Closed on
Jun 18, 2015
Sold by
Lee Israelsen O Allen and Lee Winston Kathy
Bought by
Fenyves Lee and Adler Laina
Home Financials for this Owner
Home Financials are based on the most recent Mortgage that was taken out on this home.
Original Mortgage
$761,250
Interest Rate
3.81%
Mortgage Type
New Conventional
Purchase Details
Closed on
Mar 31, 2009
Sold by
Israelsen Orson A and Israelsen Agnes
Bought by
Israelsen O Allen and Israelsen Agnes E
Home Financials for this Owner
Home Financials are based on the most recent Mortgage that was taken out on this home.
Original Mortgage
$369,000
Interest Rate
4.91%
Mortgage Type
Purchase Money Mortgage
Purchase Details
Closed on
Feb 17, 2009
Sold by
Jasso Reyna
Bought by
Israelsen Orsen A and Israelsen Agnes
Home Financials for this Owner
Home Financials are based on the most recent Mortgage that was taken out on this home.
Original Mortgage
$369,000
Interest Rate
4.91%
Mortgage Type
Purchase Money Mortgage
Purchase Details
Closed on
Apr 5, 2006
Sold by
Auther Jennifer Lynn and Auther Norman V
Bought by
Jasso Reyna
Home Financials for this Owner
Home Financials are based on the most recent Mortgage that was taken out on this home.
Original Mortgage
$524,000
Interest Rate
7%
Mortgage Type
Fannie Mae Freddie Mac
Purchase Details
Closed on
Jan 9, 2006
Sold by
Jasso Luis J
Bought by
Jasso Reyna
Home Financials for this Owner
Home Financials are based on the most recent Mortgage that was taken out on this home.
Original Mortgage
$98,250
Interest Rate
5.98%
Mortgage Type
Purchase Money Mortgage
Create a Home Valuation Report for This Property
The Home Valuation Report is an in-depth analysis detailing your home's value as well as a comparison with similar homes in the area
Home Values in the Area
Average Home Value in this Area
Purchase History
| Date | Buyer | Sale Price | Title Company |
|---|---|---|---|
| Laina Marian Adler And Lee Fenyves Revocable | -- | None Listed On Document | |
| Fenyves Lee | $1,015,000 | Chicago Title Company | |
| Israelsen O Allen | -- | None Available | |
| Israelsen Orsen A | $410,000 | Stca State Title North | |
| Jasso Reyna | $655,000 | Old Republic Title Company | |
| Jasso Reyna | -- | Old Republic Title Company |
Source: Public Records
Mortgage History
| Date | Status | Borrower | Loan Amount |
|---|---|---|---|
| Previous Owner | Fenyves Lee | $761,250 | |
| Previous Owner | Israelsen Orsen A | $369,000 | |
| Previous Owner | Jasso Reyna | $524,000 | |
| Previous Owner | Jasso Reyna | $98,250 |
Source: Public Records
Tax History
| Year | Tax Paid | Tax Assessment Tax Assessment Total Assessment is a certain percentage of the fair market value that is determined by local assessors to be the total taxable value of land and additions on the property. | Land | Improvement |
|---|---|---|---|---|
| 2025 | $17,333 | $1,194,525 | $360,457 | $841,068 |
| 2024 | $17,333 | $1,170,967 | $353,390 | $824,577 |
| 2023 | $16,984 | $1,147,877 | $346,463 | $808,414 |
| 2022 | $16,704 | $1,125,231 | $339,669 | $792,562 |
| 2021 | $16,760 | $1,103,034 | $333,010 | $777,024 |
| 2020 | $15,912 | $1,098,655 | $329,596 | $769,059 |
| 2019 | $15,345 | $1,077,117 | $323,135 | $753,982 |
| 2018 | $15,103 | $1,056,005 | $316,801 | $739,204 |
| 2017 | $14,587 | $1,035,300 | $310,590 | $724,710 |
| 2016 | $14,163 | $1,015,000 | $304,500 | $710,500 |
| 2015 | $7,219 | $439,298 | $131,789 | $307,509 |
| 2014 | $7,147 | $430,696 | $129,209 | $301,487 |
Source: Public Records
Map
Nearby Homes
- 2922 Stanton St
- 2790 Sacramento St
- 2782 Sacramento St
- 2774 Sacramento St
- 2758 Sacramento St
- 1314 Ashby Ave
- 1450 Ward St
- 2750 Sacramento St
- 1535 Julia St
- 1530 Stuart St
- 1237 Ashby Ave
- 1507 Prince St
- 3032 Mabel St
- 2751 Wallace St
- 1515 Derby St
- 3101 Sacramento St
- 2747 San Pablo Ave Unit 507
- 3110 California St
- 1646 Ashby Ave
- 3114 California St
Your Personal Tour Guide
Ask me questions while you tour the home.