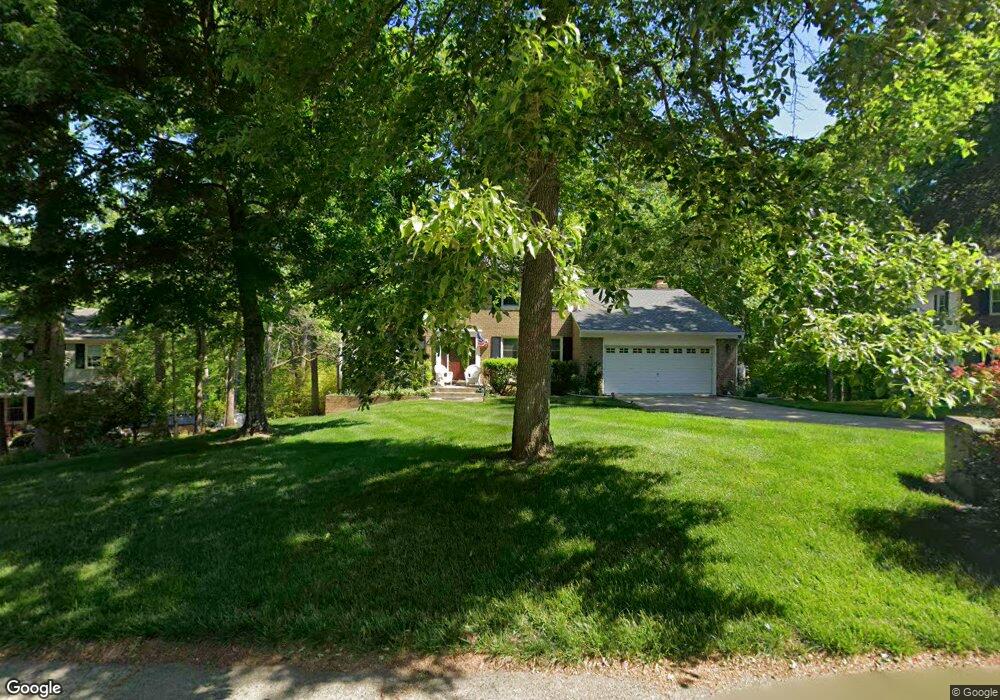
2812 John Coffee Ct Woodbridge, VA 22192
Estimated Value: $726,288 - $836,000
5
Beds
4
Baths
2,668
Sq Ft
$292/Sq Ft
Est. Value
About This Home
This home is located at 2812 John Coffee Ct, Woodbridge, VA 22192 and is currently estimated at $780,322, approximately $292 per square foot. 2812 John Coffee Ct is a home located in Prince William County with nearby schools including Antietam Elementary School, Lake Ridge Middle School, and Woodbridge High School.
Ownership History
Date
Name
Owned For
Owner Type
Purchase Details
Closed on
Oct 25, 2011
Sold by
Hall Brice and Hall Aysen
Bought by
Replogle Hugh B and Replogle Jean J
Current Estimated Value
Home Financials for this Owner
Home Financials are based on the most recent Mortgage that was taken out on this home.
Original Mortgage
$368,000
Outstanding Balance
$251,111
Interest Rate
4.11%
Mortgage Type
New Conventional
Estimated Equity
$529,211
Purchase Details
Closed on
Jun 23, 2009
Sold by
Sitterly Daniel R and Sitterly Misako S
Bought by
Hall Brice and Hall Aysen
Home Financials for this Owner
Home Financials are based on the most recent Mortgage that was taken out on this home.
Original Mortgage
$498,939
Interest Rate
5%
Mortgage Type
VA
Purchase Details
Closed on
Aug 14, 2000
Sold by
Nees Randy E
Bought by
Sitterly Daniel R
Home Financials for this Owner
Home Financials are based on the most recent Mortgage that was taken out on this home.
Original Mortgage
$227,200
Interest Rate
8.21%
Create a Home Valuation Report for This Property
The Home Valuation Report is an in-depth analysis detailing your home's value as well as a comparison with similar homes in the area
Home Values in the Area
Average Home Value in this Area
Purchase History
| Date | Buyer | Sale Price | Title Company |
|---|---|---|---|
| Replogle Hugh B | $460,000 | Stewart Title Guaranty Co | |
| Hall Brice | $483,000 | Fidelity National Title Ins | |
| Sitterly Daniel R | $284,000 | -- |
Source: Public Records
Mortgage History
| Date | Status | Borrower | Loan Amount |
|---|---|---|---|
| Open | Replogle Hugh B | $368,000 | |
| Previous Owner | Hall Brice | $498,939 | |
| Previous Owner | Sitterly Daniel R | $227,200 |
Source: Public Records
Tax History Compared to Growth
Tax History
| Year | Tax Paid | Tax Assessment Tax Assessment Total Assessment is a certain percentage of the fair market value that is determined by local assessors to be the total taxable value of land and additions on the property. | Land | Improvement |
|---|---|---|---|---|
| 2025 | $6,783 | $689,100 | $222,500 | $466,600 |
| 2024 | $6,783 | $682,100 | $220,200 | $461,900 |
| 2023 | $6,739 | $647,700 | $207,700 | $440,000 |
| 2022 | $6,961 | $628,500 | $199,700 | $428,800 |
| 2021 | $6,692 | $549,700 | $173,700 | $376,000 |
| 2020 | $8,062 | $520,100 | $163,900 | $356,200 |
| 2019 | $7,969 | $514,100 | $162,200 | $351,900 |
| 2018 | $6,121 | $506,900 | $159,100 | $347,800 |
| 2017 | $5,921 | $481,600 | $150,200 | $331,400 |
| 2016 | $5,888 | $483,600 | $150,200 | $333,400 |
| 2015 | $5,540 | $450,000 | $139,000 | $311,000 |
| 2014 | $5,540 | $444,800 | $136,400 | $308,400 |
Source: Public Records
Map
Nearby Homes
- 3098 Fennegan Ct
- 2735 King Iron Ct
- 12075 Willowood Dr
- 12020 Torrey Pine Ct
- 3098 Bridgeton Ct
- 11977 William And Mary Cir
- 11846 Critton Cir
- 11828 Critton Cir
- 2568 Tree House Dr
- 3226 Foothill St
- 2842 Burgundy Place
- 12030 Cardamom Dr Unit 12030
- 12220 Redwood Ct
- 2840 Chablis Cir Unit 11A
- 11973 Cardamom Dr
- 12306 Woodlawn Ct
- 2921 Lexington Ct
- 2847 Seminole Rd
- 12239 Thyme Ln
- 12346 Woodlawn Ct
- 2814 John Coffee Ct
- 2810 John Coffee Ct
- 2809 John Coffee Ct
- 2816 John Coffee Ct
- 2811 John Coffee Ct
- 2808 John Coffee Ct
- 2807 John Coffee Ct
- 2813 John Coffee Ct
- 2806 John Coffee Ct
- 2805 John Coffee Ct
- 2804 John Coffee Ct
- 2790 Alton Hotel Ct
- 2792 Alton Hotel Ct
- 2802 John Coffee Ct
- 2796 Alton Hotel Ct
- 2794 Alton Hotel Ct
- 2798 Alton Hotel Ct
- 2807 Mount Airy Ct
- 2809 Mount Airy Ct
- 11820 Antietam Rd