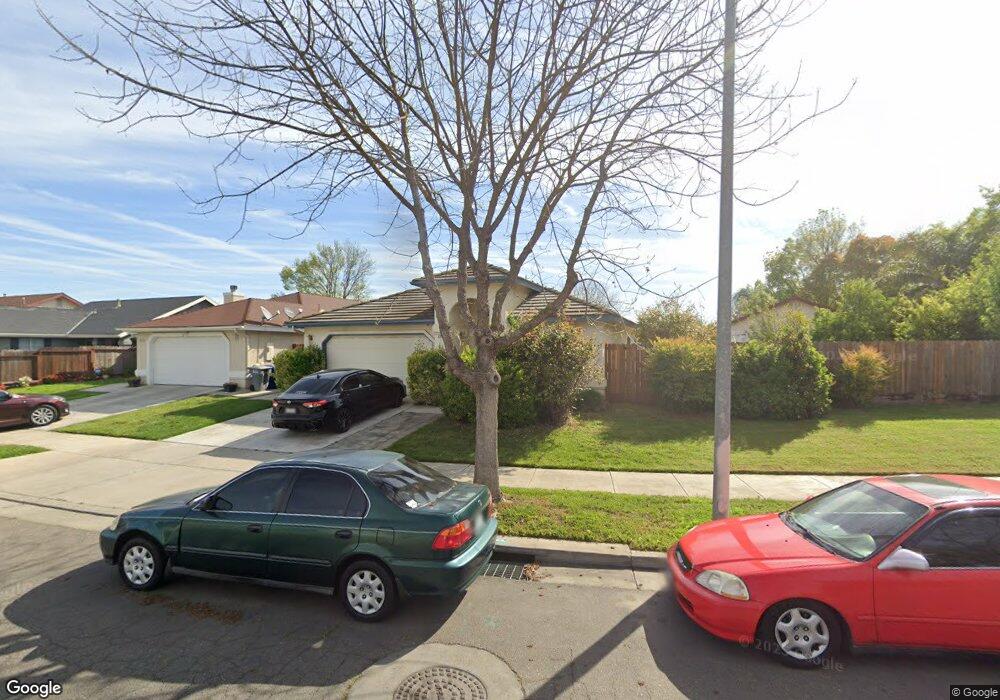
2812 La Cresenta Ave Merced, CA 95348
Estimated Value: $351,000 - $372,000
5
Beds
2
Baths
1,458
Sq Ft
$249/Sq Ft
Est. Value
About This Home
This home is located at 2812 La Cresenta Ave, Merced, CA 95348 and is currently estimated at $362,332, approximately $248 per square foot. 2812 La Cresenta Ave is a home located in Merced County with nearby schools including Luther Burbank Elementary School, Tenaya Middle School, and Merced High School.
Ownership History
Date
Name
Owned For
Owner Type
Purchase Details
Closed on
Jan 9, 2004
Sold by
Pornnang Boonchan and Pornnang Manivan
Bought by
Pornnang Boonchan
Current Estimated Value
Home Financials for this Owner
Home Financials are based on the most recent Mortgage that was taken out on this home.
Original Mortgage
$130,000
Outstanding Balance
$60,627
Interest Rate
5.86%
Mortgage Type
Stand Alone Refi Refinance Of Original Loan
Estimated Equity
$301,705
Purchase Details
Closed on
Aug 18, 1997
Sold by
Westside Development Inc
Bought by
Pornnang Boonchan and Pornnang Manivan
Home Financials for this Owner
Home Financials are based on the most recent Mortgage that was taken out on this home.
Original Mortgage
$91,871
Interest Rate
7.05%
Mortgage Type
FHA
Create a Home Valuation Report for This Property
The Home Valuation Report is an in-depth analysis detailing your home's value as well as a comparison with similar homes in the area
Purchase History
| Date | Buyer | Sale Price | Title Company |
|---|---|---|---|
| Pornnang Boonchan | -- | First American Title Ins Co | |
| Pornnang Boonchan | $102,500 | Fidelity National Title Co |
Source: Public Records
Mortgage History
| Date | Status | Borrower | Loan Amount |
|---|---|---|---|
| Open | Pornnang Boonchan | $130,000 | |
| Previous Owner | Pornnang Boonchan | $91,871 |
Source: Public Records
Tax History
| Year | Tax Paid | Tax Assessment Tax Assessment Total Assessment is a certain percentage of the fair market value that is determined by local assessors to be the total taxable value of land and additions on the property. | Land | Improvement |
|---|---|---|---|---|
| 2025 | $1,727 | $163,321 | $39,906 | $123,415 |
| 2024 | $1,727 | $160,120 | $39,124 | $120,996 |
| 2023 | $1,703 | $156,981 | $38,357 | $118,624 |
| 2022 | $1,748 | $153,904 | $37,605 | $116,299 |
| 2021 | $1,734 | $150,887 | $36,868 | $114,019 |
| 2020 | $1,675 | $149,340 | $36,490 | $112,850 |
| 2019 | $1,653 | $146,413 | $35,775 | $110,638 |
| 2018 | $1,508 | $143,543 | $35,074 | $108,469 |
| 2017 | $1,552 | $140,730 | $34,387 | $106,343 |
| 2016 | $1,526 | $137,971 | $33,713 | $104,258 |
| 2015 | $1,495 | $135,899 | $33,207 | $102,692 |
| 2014 | $1,459 | $133,238 | $32,557 | $100,681 |
Source: Public Records
Map
Nearby Homes
- 2790 N State Highway 59
- 1482 Autry Way
- 2500 N State Highway 59 Unit 36
- 2500 N State Highway 59 Unit 278
- 2500 N State Highway 59 Unit 239
- 2500 N State Highway 59 Unit 18
- 2500 N State Highway 59
- 1463 W 25th St
- 1963 Shadowbrook Dr
- 1973 Shadowbrook Dr
- 1541 W North Bear Creek Dr
- 1648 W North Bear Creek Dr
- 1664 W North Bear Creek Dr Unit 5
- 1656 W North Bear Creek Dr Unit 9
- 1646 W North Bear Creek Dr
- 3157 Juneau Ct
- 1441 W 20th St
- 1438 W 19th St
- 3251 Cheyenne Dr
- 1274 Devonwood Dr
- 2822 La Cresenta Ave
- 2815 La Palma Ave
- 2825 La Palma Ave
- 2835 La Palma Ave
- 2832 La Cresenta Ave
- 2811 La Cresenta Ave
- 2821 La Cresenta Ave
- 2845 La Palma Ave
- 2831 La Cresenta Ave
- 2790 Stonybrook Ave
- 2842 La Cresenta Ave
- 2841 La Cresenta Ave
- 2855 La Palma Ave
- 2789 Portola Way
- 2791 Stonybrook Ave
- 2851 La Cresenta Ave
- 2852 La Cresenta Ave
- 2814 La Palma Ave
- 2824 La Palma Ave
- 2785 Portola Way
Your Personal Tour Guide
Ask me questions while you tour the home.