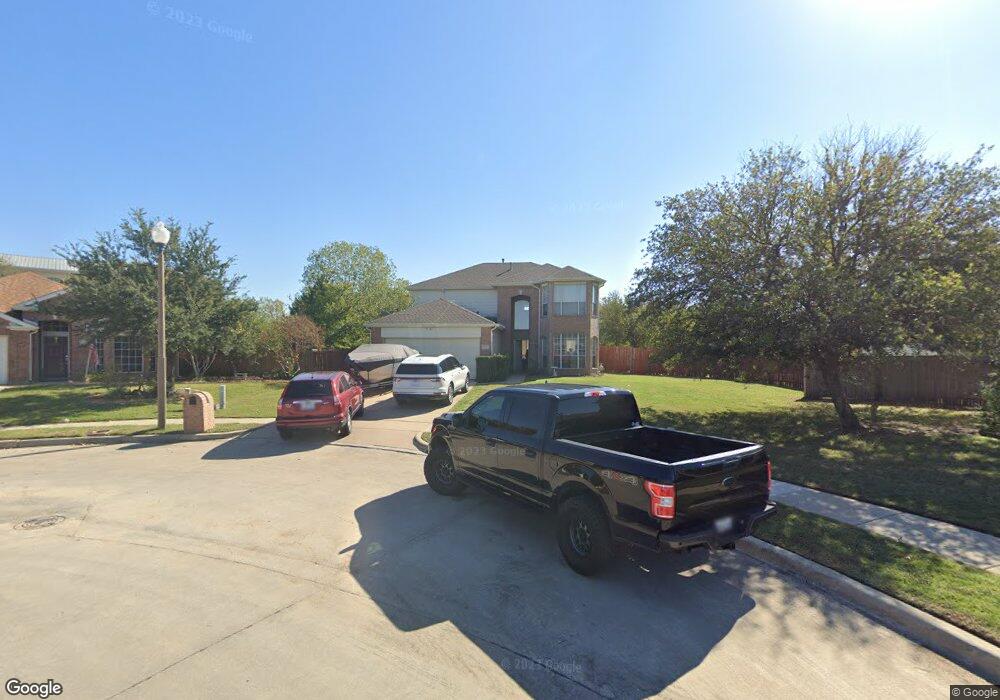
2812 Loon Lake Rd Denton, TX 76210
South Denton NeighborhoodEstimated Value: $426,000 - $442,000
4
Beds
3
Baths
2,535
Sq Ft
$170/Sq Ft
Est. Value
About This Home
This home is located at 2812 Loon Lake Rd, Denton, TX 76210 and is currently estimated at $431,825, approximately $170 per square foot. 2812 Loon Lake Rd is a home located in Denton County with nearby schools including Houston Elementary School, McMath Middle School, and Denton High School.
Ownership History
Date
Name
Owned For
Owner Type
Purchase Details
Closed on
May 25, 2006
Sold by
Wells Fargo Bank Na
Bought by
Nelson Terence C and Nelson Alicia L
Current Estimated Value
Home Financials for this Owner
Home Financials are based on the most recent Mortgage that was taken out on this home.
Original Mortgage
$128,000
Outstanding Balance
$74,150
Interest Rate
6.5%
Mortgage Type
Fannie Mae Freddie Mac
Estimated Equity
$357,675
Purchase Details
Closed on
Mar 7, 2006
Sold by
Delolmo Jose A
Bought by
Wells Fargo Bank Na and Certificateholders Of First Franklin Mor
Purchase Details
Closed on
Mar 22, 2003
Sold by
Delolmo Sylvia
Bought by
Delolmo Jose A
Purchase Details
Closed on
Feb 23, 2001
Sold by
Pulte Homes Of Texas Lp
Bought by
Delolmo Jose A and Delolmo Sylvia
Home Financials for this Owner
Home Financials are based on the most recent Mortgage that was taken out on this home.
Original Mortgage
$146,700
Interest Rate
6.97%
Create a Home Valuation Report for This Property
The Home Valuation Report is an in-depth analysis detailing your home's value as well as a comparison with similar homes in the area
Home Values in the Area
Average Home Value in this Area
Purchase History
| Date | Buyer | Sale Price | Title Company |
|---|---|---|---|
| Nelson Terence C | -- | Rtt | |
| Wells Fargo Bank Na | $139,275 | None Available | |
| Delolmo Jose A | -- | -- | |
| Delolmo Jose A | -- | -- | |
| Delolmo Jose A | -- | -- |
Source: Public Records
Mortgage History
| Date | Status | Borrower | Loan Amount |
|---|---|---|---|
| Open | Nelson Terence C | $128,000 | |
| Previous Owner | Delolmo Jose A | $146,700 |
Source: Public Records
Tax History Compared to Growth
Tax History
| Year | Tax Paid | Tax Assessment Tax Assessment Total Assessment is a certain percentage of the fair market value that is determined by local assessors to be the total taxable value of land and additions on the property. | Land | Improvement |
|---|---|---|---|---|
| 2025 | $7,045 | $406,000 | $86,904 | $319,096 |
| 2024 | $7,045 | $365,000 | $86,904 | $278,096 |
| 2023 | $7,160 | $375,000 | $77,607 | $297,393 |
| 2022 | $7,430 | $350,000 | $86,904 | $263,096 |
| 2021 | $6,336 | $285,000 | $68,012 | $216,988 |
| 2020 | $5,943 | $260,000 | $68,012 | $191,988 |
| 2019 | $6,400 | $268,220 | $68,012 | $200,208 |
| 2018 | $5,556 | $230,000 | $68,012 | $161,988 |
| 2017 | $5,240 | $212,000 | $68,012 | $143,988 |
| 2016 | $5,020 | $203,097 | $45,341 | $157,756 |
| 2015 | $4,667 | $196,113 | $45,341 | $150,772 |
| 2014 | $4,667 | $186,523 | $45,341 | $141,182 |
| 2013 | -- | $176,368 | $45,341 | $131,027 |
Source: Public Records
Map
Nearby Homes
- 2713 Clubhouse Dr
- 2600 Pioneer Dr
- 2913 Montebello Dr
- 2917 Montebello Dr
- 3428 Tuscan Hills Cir
- 2508 Pioneer Dr
- 2505 Pioneer Dr
- 3009 Montebello Dr
- 2721 Arabian Ave
- 2409 Loon Lake Rd
- 2601 Pinto Dr
- 3448 Tuscan Hills Cir
- 2817 Hereford Rd
- 3000 Bella Lago Dr
- 2617 Hereford Rd
- 2312 Caddo Cir
- 2804 Hollow Ridge Dr
- 2617 Hollow Ridge Dr
- 2501 Great Bear Ln
- 2209 Loon Lake Rd
- 3237 Como Lake Rd
- 2808 Loon Lake Rd
- 3233 Como Lake Rd
- 2804 Loon Lake Rd
- 2809 Loon Lake Rd
- 3229 Como Lake Rd
- 2805 Loon Lake Rd
- 2800 Shoreline Dr Unit 240250
- 2800 Shoreline Dr Unit 240
- 2800 Shoreline Dr Unit 250
- 3225 Como Lake Rd
- 3224 Como Lake Rd
- 2801 Loon Lake Rd
- 3221 Como Lake Rd
- 3220 Como Lake Rd
- 2716 Loon Lake Rd
- 3221 Herring Ct
- 3217 Como Lake Rd
- 3216 Como Lake Rd
- 2712 Loon Lake Rd