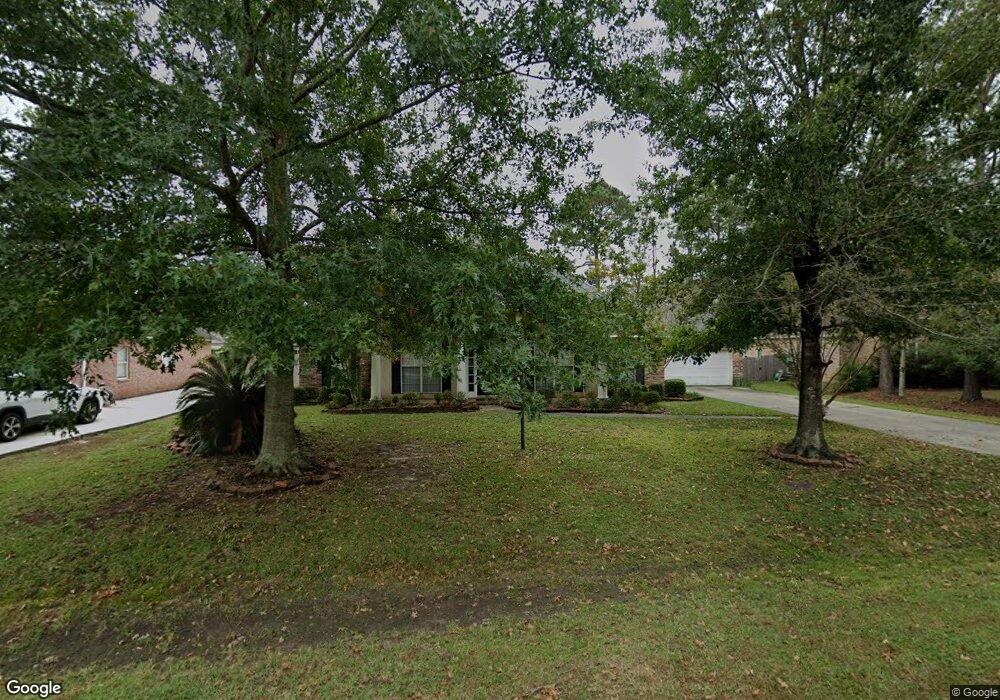
2812 Mesa Ct Mandeville, LA 70448
Estimated Value: $426,000 - $429,302
4
Beds
3
Baths
2,279
Sq Ft
$188/Sq Ft
Est. Value
About This Home
This home is located at 2812 Mesa Ct, Mandeville, LA 70448 and is currently estimated at $427,826, approximately $187 per square foot. 2812 Mesa Ct is a home located in St. Tammany Parish with nearby schools including Marigny Elementary School, Mandeville Middle School, and Magnolia Trace Elementary School.
Ownership History
Date
Name
Owned For
Owner Type
Purchase Details
Closed on
Jan 12, 2010
Sold by
Scott William Wood and Scott Angela Thompson
Bought by
Larocca Joseph Bernard and Larocca Kelly Sullivan
Current Estimated Value
Home Financials for this Owner
Home Financials are based on the most recent Mortgage that was taken out on this home.
Original Mortgage
$273,455
Outstanding Balance
$176,461
Interest Rate
4.93%
Mortgage Type
FHA
Estimated Equity
$251,365
Create a Home Valuation Report for This Property
The Home Valuation Report is an in-depth analysis detailing your home's value as well as a comparison with similar homes in the area
Home Values in the Area
Average Home Value in this Area
Purchase History
| Date | Buyer | Sale Price | Title Company |
|---|---|---|---|
| Larocca Joseph Bernard | $278,500 | Cresent Title Llc |
Source: Public Records
Mortgage History
| Date | Status | Borrower | Loan Amount |
|---|---|---|---|
| Open | Larocca Joseph Bernard | $273,455 |
Source: Public Records
Tax History
| Year | Tax Paid | Tax Assessment Tax Assessment Total Assessment is a certain percentage of the fair market value that is determined by local assessors to be the total taxable value of land and additions on the property. | Land | Improvement |
|---|---|---|---|---|
| 2025 | $2,994 | $32,065 | $6,180 | $25,885 |
| 2024 | $2,994 | $32,065 | $6,180 | $25,885 |
| 2023 | $3,103 | $26,902 | $6,180 | $20,722 |
| 2022 | $261,229 | $26,902 | $6,180 | $20,722 |
| 2021 | $2,607 | $26,902 | $6,180 | $20,722 |
| 2020 | $2,605 | $26,902 | $6,180 | $20,722 |
| 2019 | $3,621 | $26,118 | $6,000 | $20,118 |
| 2018 | $3,626 | $26,118 | $6,000 | $20,118 |
| 2017 | $3,619 | $26,118 | $6,000 | $20,118 |
| 2016 | $3,648 | $26,118 | $6,000 | $20,118 |
| 2015 | $2,378 | $23,828 | $5,100 | $18,728 |
| 2014 | $2,353 | $23,828 | $5,100 | $18,728 |
| 2013 | -- | $23,828 | $5,100 | $18,728 |
Source: Public Records
Map
Nearby Homes
- 2948 Desert Ct
- 3041 Mountain Ct
- 1165 Brook Ct
- 3160 Grove Ct
- 23123 Highway 1088 None
- 22536 Highway 1088
- 23123 Highway 1088
- 23201 Highway 1088
- 2761 Rue Weller
- 65398 Maple St
- 4A-1 Maple St
- 607 Dean St
- 623 Beaulieux St
- 2427 Biron St
- Lot 5 Biron St
- Lot 1 Biron St
- Lot 4 Biron St
- Lot 2 Biron St
- Lot 3 Biron St
Your Personal Tour Guide
Ask me questions while you tour the home.