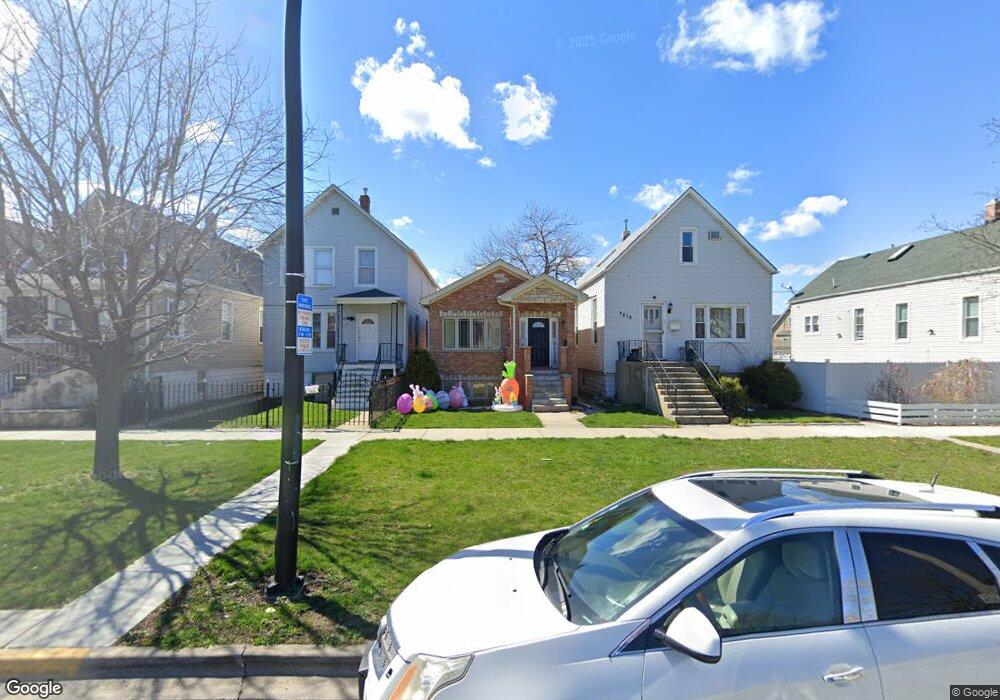
2812 S 50th Ave Cicero, IL 60804
Estimated Value: $326,000 - $362,000
5
Beds
3
Baths
1,254
Sq Ft
$275/Sq Ft
Est. Value
About This Home
This home is located at 2812 S 50th Ave, Cicero, IL 60804 and is currently estimated at $344,587, approximately $274 per square foot. 2812 S 50th Ave is a home located in Cook County with nearby schools including Liberty Elementary School, Unity Jr High School, and J Sterling Morton Freshman Center.
Ownership History
Date
Name
Owned For
Owner Type
Purchase Details
Closed on
Oct 30, 2014
Sold by
Arroyo Edith L and Pacheco Jenny
Bought by
Arroyo Edith L
Current Estimated Value
Purchase Details
Closed on
Oct 24, 2011
Sold by
Jav Group Investments Corp
Bought by
Arroyo Edith L and Pacheco Jenny
Home Financials for this Owner
Home Financials are based on the most recent Mortgage that was taken out on this home.
Original Mortgage
$122,805
Outstanding Balance
$84,361
Interest Rate
4.25%
Mortgage Type
FHA
Estimated Equity
$260,226
Purchase Details
Closed on
Nov 1, 2010
Sold by
Komperda Bogdan
Bought by
Jav Group Investment Corp
Purchase Details
Closed on
Sep 28, 2007
Sold by
Wilson Charles
Bought by
Komperda Bogdan and Komperda Yolanda
Purchase Details
Closed on
Nov 7, 2005
Sold by
Wilson Chuck
Bought by
Glod Piotr
Create a Home Valuation Report for This Property
The Home Valuation Report is an in-depth analysis detailing your home's value as well as a comparison with similar homes in the area
Home Values in the Area
Average Home Value in this Area
Purchase History
| Date | Buyer | Sale Price | Title Company |
|---|---|---|---|
| Arroyo Edith L | -- | Chicago Title Insurance Co | |
| Arroyo Edith L | $126,000 | Multiple | |
| Jav Group Investment Corp | $40,000 | None Available | |
| Komperda Bogdan | $37,500 | Git | |
| Glod Piotr | $2,000 | -- |
Source: Public Records
Mortgage History
| Date | Status | Borrower | Loan Amount |
|---|---|---|---|
| Open | Arroyo Edith L | $122,805 |
Source: Public Records
Tax History Compared to Growth
Tax History
| Year | Tax Paid | Tax Assessment Tax Assessment Total Assessment is a certain percentage of the fair market value that is determined by local assessors to be the total taxable value of land and additions on the property. | Land | Improvement |
|---|---|---|---|---|
| 2024 | $7,336 | $25,000 | $4,676 | $20,324 |
| 2023 | $6,312 | $25,000 | $4,676 | $20,324 |
| 2022 | $6,312 | $17,874 | $4,024 | $13,850 |
| 2021 | $6,277 | $17,872 | $4,023 | $13,849 |
| 2020 | $6,199 | $17,872 | $4,023 | $13,849 |
| 2019 | $6,913 | $17,390 | $3,697 | $13,693 |
| 2018 | $6,728 | $17,390 | $3,697 | $13,693 |
| 2017 | $6,513 | $17,390 | $3,697 | $13,693 |
| 2016 | $4,770 | $12,300 | $3,045 | $9,255 |
| 2015 | $4,653 | $12,300 | $3,045 | $9,255 |
| 2014 | $4,504 | $12,300 | $3,045 | $9,255 |
| 2013 | $5,267 | $12,600 | $3,045 | $9,555 |
Source: Public Records
Map
Nearby Homes
- 4916 W 29th St
- 5011 W 26th St
- 2919 S 49th Ave
- 2921 S 49th Ave
- 5059 W 29th Place
- 2304 S Laramie Ave
- 4817 W 28th St
- 4915 W 30th St
- 2934 S 48th Ct
- 2938 48th Ct
- 5131 W 25th Place
- 5028 W 31st Place
- 5234 W 25th Place
- 5241 W 30th St
- 3117 S Laramie Ave Unit 3N
- 4821 W 24th St
- 4815 W 24th St
- 5129 W 31st Place
- 5108 W 32nd St
- 5017 W 32nd St
- 2810 S 50th Ave
- 2816 S 50th Ave
- 2808 S 50th Ave
- 2818 S 50th Ave
- 2806 S 50th Ave
- 2820 S 50th Ave
- 5015 W Ogden Ave
- 5017 W Ogden Ave
- 5013 W Ogden Ave
- 2824 S 50th Ave
- 5019 W Ogden Ave
- 2815 S 50th Ct
- 2828 S 50th Ave
- 2819 S 50th Ct
- 2830 S 50th Ave
- 5001 W Ogden Ave
- 4929 W 28th St
- 4929 W 28th St
- 2815 S 50th Ct
- 2832 S 50th Ave