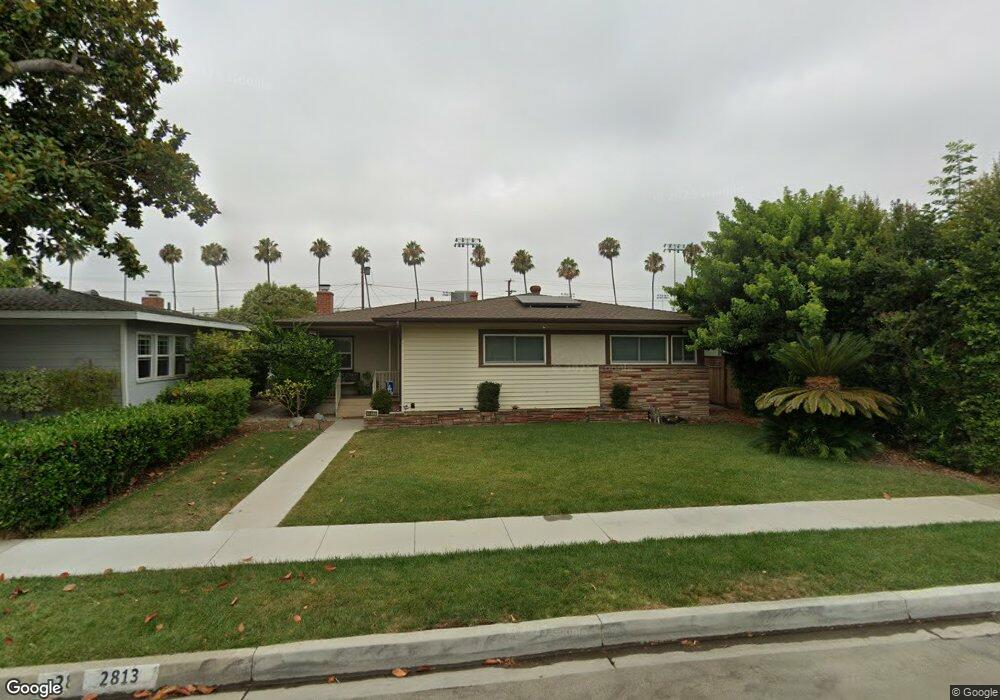
2813 Hackett Ave Long Beach, CA 90815
El Dorado Park NeighborhoodEstimated Value: $1,053,000 - $1,209,000
4
Beds
2
Baths
1,498
Sq Ft
$760/Sq Ft
Est. Value
About This Home
This home is located at 2813 Hackett Ave, Long Beach, CA 90815 and is currently estimated at $1,139,041, approximately $760 per square foot. 2813 Hackett Ave is a home located in Los Angeles County with nearby schools including Stanford Middle School, Millikan High School, and Los Altos Grace Schools.
Ownership History
Date
Name
Owned For
Owner Type
Purchase Details
Closed on
Jun 20, 2024
Sold by
Pili Living Trust and Pili Renaldo
Bought by
Pili Christopher P and Pili Sandra
Current Estimated Value
Home Financials for this Owner
Home Financials are based on the most recent Mortgage that was taken out on this home.
Original Mortgage
$599,000
Outstanding Balance
$591,356
Interest Rate
7.02%
Mortgage Type
New Conventional
Estimated Equity
$547,685
Purchase Details
Closed on
Jul 15, 1998
Sold by
Pili Rosario P
Bought by
Pili Rosario B and The Pili Living Trust
Home Financials for this Owner
Home Financials are based on the most recent Mortgage that was taken out on this home.
Original Mortgage
$125,000
Interest Rate
7.01%
Purchase Details
Closed on
Jun 11, 1997
Sold by
Pili Rosario P
Bought by
Pili Rosario B and The Pili Living Trust
Create a Home Valuation Report for This Property
The Home Valuation Report is an in-depth analysis detailing your home's value as well as a comparison with similar homes in the area
Home Values in the Area
Average Home Value in this Area
Purchase History
| Date | Buyer | Sale Price | Title Company |
|---|---|---|---|
| Pili Christopher P | -- | Old Republic National Title | |
| Pili Rosario B | -- | Gateway Title Company | |
| Pili Rosario B | -- | Gateway Title Company | |
| Pili Rosario B | -- | -- |
Source: Public Records
Mortgage History
| Date | Status | Borrower | Loan Amount |
|---|---|---|---|
| Open | Pili Christopher P | $599,000 | |
| Previous Owner | Pili Rosario B | $125,000 |
Source: Public Records
Tax History
| Year | Tax Paid | Tax Assessment Tax Assessment Total Assessment is a certain percentage of the fair market value that is determined by local assessors to be the total taxable value of land and additions on the property. | Land | Improvement |
|---|---|---|---|---|
| 2025 | $2,605 | $1,080,180 | $861,900 | $218,280 |
| 2024 | $2,605 | $187,069 | $82,358 | $104,711 |
| 2023 | $2,565 | $183,402 | $80,744 | $102,658 |
| 2022 | $2,418 | $179,807 | $79,161 | $100,646 |
| 2021 | $2,366 | $176,282 | $77,609 | $98,673 |
| 2019 | $2,329 | $171,056 | $75,308 | $95,748 |
| 2018 | $2,205 | $167,703 | $73,832 | $93,871 |
| 2016 | $2,017 | $161,193 | $70,966 | $90,227 |
| 2015 | $1,940 | $158,773 | $69,901 | $88,872 |
| 2014 | $1,931 | $155,664 | $68,532 | $87,132 |
Source: Public Records
Map
Nearby Homes
- 3012 Knoxville Ave
- 2715 Petaluma Ave
- 6110 E Walton St
- 2690 Senasac Ave
- 2345 Palo Verde Ave
- 6448 E Los Arcos St
- 2306 Carfax Ave
- 2419 Ostrom Ave
- 2330 Josie Ave
- 3062 Lees Ave
- 3166 Senasac Ave
- 6702 E El Salvador St
- 3326 Hackett Ave
- 2276 Fanwood Ave
- 3034 Ocana Ave
- 3044 Ocana Ave
- 2137 Ostrom Ave
- 7147 E Metz St
- 3120 San Anseline Ave
- 3502 Monogram Ave
- 2819 Hackett Ave
- 2809 Hackett Ave
- 2825 Hackett Ave
- 2803 Hackett Ave
- 2812 Palo Verde Ave
- 2808 Palo Verde Ave
- 2818 Palo Verde Ave
- 2812 Hackett Ave
- 2818 Hackett Ave
- 2831 Hackett Ave
- 2824 Palo Verde Ave
- 2802 Palo Verde Ave
- 2808 Hackett Ave
- 2824 Hackett Ave
- 2757 Hackett Ave
- 2802 Hackett Ave
- 2828 Palo Verde Ave
- 2835 Hackett Ave
- 2828 Hackett Ave
- 2756 Palo Verde Ave
Your Personal Tour Guide
Ask me questions while you tour the home.