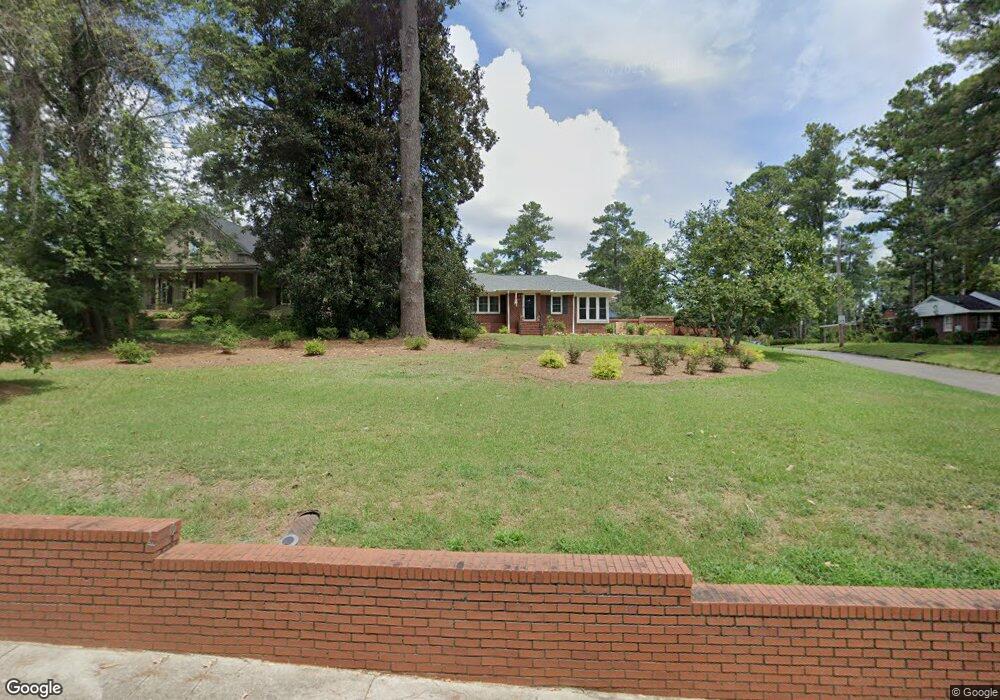
2813 Ingleside Dr Augusta, GA 30909
West Augusta NeighborhoodEstimated Value: $323,832 - $355,000
4
Beds
3
Baths
2,691
Sq Ft
$126/Sq Ft
Est. Value
About This Home
This home is located at 2813 Ingleside Dr, Augusta, GA 30909 and is currently estimated at $339,458, approximately $126 per square foot. 2813 Ingleside Dr is a home located in Richmond County with nearby schools including Tutt Middle School, Johnson Magnet, and Westside High School.
Ownership History
Date
Name
Owned For
Owner Type
Purchase Details
Closed on
Jul 24, 2006
Sold by
Suddeth Marcia L
Bought by
Fulmer Nancy Sue
Current Estimated Value
Purchase Details
Closed on
Nov 22, 2002
Sold by
Perry Andrew C and Perry Margaret M
Bought by
Suddeth Marcia L
Home Financials for this Owner
Home Financials are based on the most recent Mortgage that was taken out on this home.
Original Mortgage
$107,910
Interest Rate
6.15%
Purchase Details
Closed on
Jan 18, 2002
Sold by
Steed Jeanette Beals Ak and Steed William Alexander
Bought by
Perry Andrew C and Perry Margaret M
Home Financials for this Owner
Home Financials are based on the most recent Mortgage that was taken out on this home.
Original Mortgage
$108,202
Interest Rate
7.08%
Mortgage Type
FHA
Purchase Details
Closed on
Jun 26, 1997
Sold by
Steed Jeanette Beal
Bought by
Steed Jeanette Beal
Create a Home Valuation Report for This Property
The Home Valuation Report is an in-depth analysis detailing your home's value as well as a comparison with similar homes in the area
Home Values in the Area
Average Home Value in this Area
Purchase History
| Date | Buyer | Sale Price | Title Company |
|---|---|---|---|
| Fulmer Nancy Sue | -- | None Available | |
| Suddeth Marcia L | $119,900 | -- | |
| Perry Andrew C | $109,900 | -- | |
| Steed Jeanette Beal | -- | -- |
Source: Public Records
Mortgage History
| Date | Status | Borrower | Loan Amount |
|---|---|---|---|
| Previous Owner | Suddeth Marcia L | $107,910 | |
| Previous Owner | Perry Andrew C | $108,202 |
Source: Public Records
Tax History
| Year | Tax Paid | Tax Assessment Tax Assessment Total Assessment is a certain percentage of the fair market value that is determined by local assessors to be the total taxable value of land and additions on the property. | Land | Improvement |
|---|---|---|---|---|
| 2025 | $3,142 | $104,436 | $15,200 | $89,236 |
| 2024 | $3,142 | $102,336 | $15,200 | $87,136 |
| 2023 | $3,005 | $104,440 | $15,200 | $89,240 |
| 2022 | $2,782 | $90,223 | $15,200 | $75,023 |
| 2021 | $2,434 | $71,332 | $15,200 | $56,132 |
| 2020 | $2,026 | $59,070 | $13,320 | $45,750 |
| 2019 | $2,145 | $59,070 | $13,320 | $45,750 |
| 2018 | $2,160 | $59,070 | $13,320 | $45,750 |
| 2017 | $2,138 | $59,070 | $13,320 | $45,750 |
| 2016 | $2,140 | $59,070 | $13,320 | $45,750 |
| 2015 | $2,154 | $59,070 | $13,320 | $45,750 |
| 2014 | $2,157 | $59,070 | $13,320 | $45,750 |
Source: Public Records
Map
Nearby Homes
- 519 Ashland Dr
- 481 Boy Scout Rd
- 2908 Stratford Dr
- 520 Henderson Dr
- 427 Aumond Rd
- 2902 Sussex Rd
- 4 Indian Cove Rd
- 434 Aumond Rd
- 441 Aumond Rd
- 505 Stratford Dr
- 531 Boy Scout Rd
- 2918 Arrowhead Dr
- 2531 Tupelo Dr
- 533 Basin St
- 542 Basin St
- 543 Basin St
- 552 Whitehead Dr
- 568 Martin Ln
- 2507 Pinebluff Ct
- 565 Martin Ln
- 2815 Ingleside Dr
- 2811 Ingleside Dr
- 2814 Bergen Place
- 2816 Bergen Place
- 2818 Bergen Place
- 2809 Ingleside Dr
- 2817 Ingleside Dr
- 430 Kemp Dr
- 2814 Ingleside Dr
- 2812 Ingleside Dr
- 428 Kemp Dr
- 2819 Ingleside Dr
- 425 Kemp Dr
- 2810 Ingleside Dr
- 427 Ashland Dr
- 426 Ashland Dr
- 486 Boy Scout Rd
- 426 Kemp Dr
- 2808 Ingleside Dr
- 423 Kemp Dr
Your Personal Tour Guide
Ask me questions while you tour the home.