
Landlord's Agent in 2018
Jerry Johnson
RE/MAX
(813) 787-3103
21 Total Sales
Estimated Value: $583,000 - $702,000
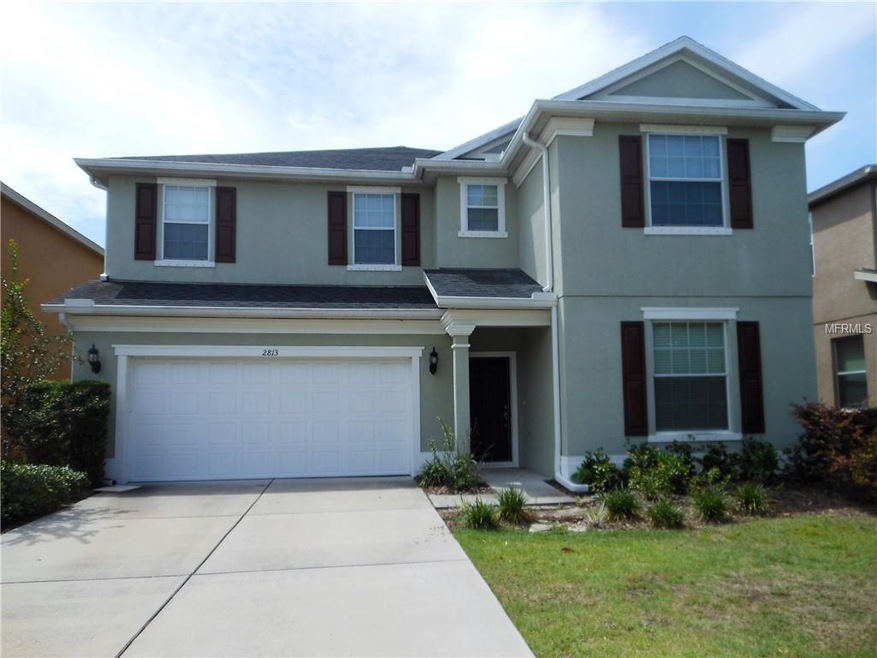
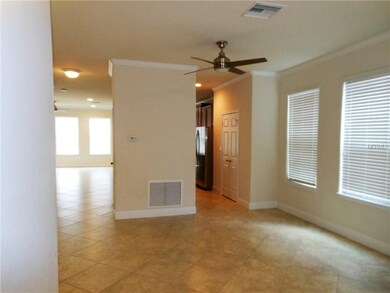
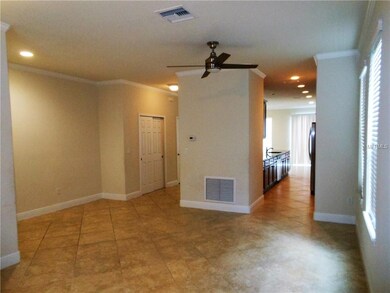
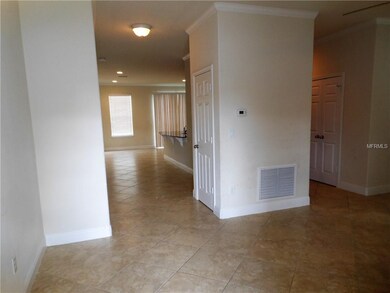
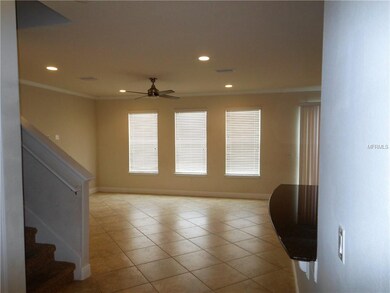
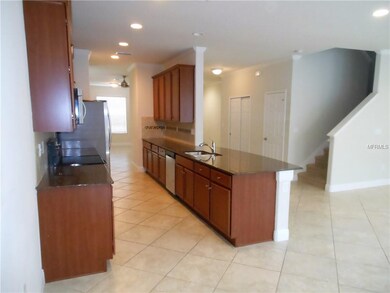
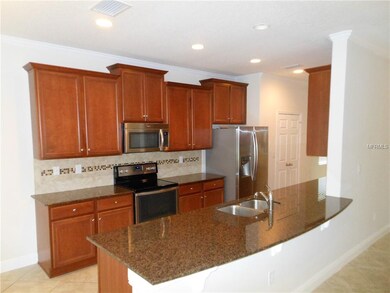
18” tile flooring run throughout downstairs with tile in wet areas upstairs. The kitchen is equipped with granite counter tops with stainless appliances. Sliders from the kitchen lead you out to a large, concrete patio. There is a bedroom on the first floor for all of your guests as well as a full bathroom. Upstairs, is a large loft area and four additional bedrooms. The master bedroom is over sized with an additional space. Master bath has double sinks, garden tub and a separate shower. Laundry is on the second floor, and all bathrooms feature granite counter tops. The community features a beautiful swimming pool, workout facility, soccer field, cricket field, and plenty of
green space to take long walks. This home is served by top rated schools and provides ease of commute.
Last Agent to Rent the Property
RE/MAX ALLIANCE GROUP License #3042544 Listed on: 07/25/2018
| Date | Buyer | Sale Price | Title Company |
|---|---|---|---|
| Desai H | $253,700 | Dba Pgp Title |
| Date | Status | Borrower | Loan Amount |
|---|---|---|---|
| Open | Desai H | $202,912 |
| Date | Event | Price | List to Sale | Price per Sq Ft |
|---|---|---|---|---|
| 09/10/2018 09/10/18 | Rented | $2,400 | 0.0% | -- |
| 08/02/2018 08/02/18 | Under Contract | -- | -- | -- |
| 07/25/2018 07/25/18 | For Rent | $2,400 | -- | -- |
| Year | Tax Paid | Tax Assessment Tax Assessment Total Assessment is a certain percentage of the fair market value that is determined by local assessors to be the total taxable value of land and additions on the property. | Land | Improvement |
|---|---|---|---|---|
| 2025 | $10,469 | $488,456 | $106,605 | $381,851 |
| 2024 | $10,469 | $486,922 | $100,682 | $386,240 |
| 2023 | $9,884 | $466,023 | $94,760 | $371,263 |
| 2022 | $9,500 | $478,707 | $88,838 | $389,869 |
| 2021 | $8,277 | $313,818 | $59,225 | $254,593 |
| 2020 | $8,158 | $308,313 | $59,225 | $249,088 |
| 2019 | $7,712 | $290,844 | $53,302 | $237,542 |
| 2018 | $5,636 | $227,121 | $0 | $0 |
| 2017 | $5,624 | $258,206 | $0 | $0 |
| 2016 | $5,564 | $217,875 | $0 | $0 |
| 2015 | $5,708 | $216,360 | $0 | $0 |
| 2014 | $5,563 | $212,469 | $0 | $0 |
| 2013 | -- | $209,329 | $0 | $0 |
Landlord's Agent in 2018
Jerry Johnson
RE/MAX
(813) 787-3103
21 Total Sales
Tenant's Agent in 2018
Amanda Burkhardt
TOWN CHASE PROPERTIES
(727) 641-2926
10 Total Sales
Source: Stellar MLS
MLS Number: H2400552
APN: U-03-27-18-9O1-000020-00062.0
Disclaimer: Certain information contained herein is derived from information provided by parties other than Homes.com. All information provided is deemed reliable, but is not guaranteed to be accurate and should be independently verified.
![]() Based on information submitted to the MLS GRID. All data is obtained from various sources and may not have been verified by broker or MLS GRID. Supplied Open House Information is subject to change without notice. All information should be independently reviewed and verified for accuracy. Properties may or may not be listed by the office/agent presenting the information. Some IDX listings have been excluded from this website. IDX information is provided exclusively for personal, non-commercial use, and may not be used for any purpose other than to identify prospective properties consumers may be interested in purchasing. Information is deemed reliable but not guaranteed.
Based on information submitted to the MLS GRID. All data is obtained from various sources and may not have been verified by broker or MLS GRID. Supplied Open House Information is subject to change without notice. All information should be independently reviewed and verified for accuracy. Properties may or may not be listed by the office/agent presenting the information. Some IDX listings have been excluded from this website. IDX information is provided exclusively for personal, non-commercial use, and may not be used for any purpose other than to identify prospective properties consumers may be interested in purchasing. Information is deemed reliable but not guaranteed.
Based on information submitted to the MLS GRID
Listing Information presented by local MLS brokerage: Ten-X - (888)-952-6393
Ask me questions while you tour the home.