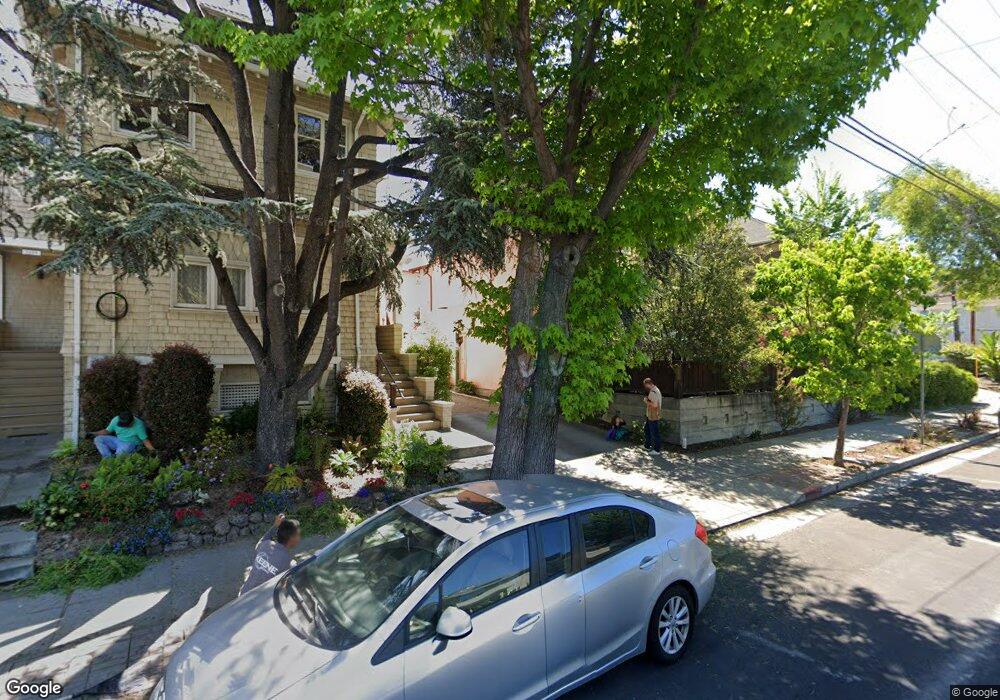
2813 Martin Luther King jr Way Unit C Berkeley, CA 94703
South Berkeley NeighborhoodEstimated Value: $736,000 - $1,000,000
2
Beds
3
Baths
1,110
Sq Ft
$759/Sq Ft
Est. Value
About This Home
This home is located at 2813 Martin Luther King jr Way Unit C, Berkeley, CA 94703 and is currently estimated at $842,205, approximately $758 per square foot. 2813 Martin Luther King jr Way Unit C is a home located in Alameda County with nearby schools including Malcolm X Elementary School, Emerson Elementary School, and John Muir Elementary School.
Ownership History
Date
Name
Owned For
Owner Type
Purchase Details
Closed on
Oct 10, 2014
Sold by
Lanes Brian S and Manfre Sandra L
Bought by
Brian Lane & Sandra Manfre Living Trust
Current Estimated Value
Purchase Details
Closed on
Aug 7, 2013
Sold by
Lanes Brian S and Manfre Sandra L
Bought by
Lanes Brian S and Manfre Sandra L
Home Financials for this Owner
Home Financials are based on the most recent Mortgage that was taken out on this home.
Original Mortgage
$462,000
Outstanding Balance
$319,894
Interest Rate
2.75%
Mortgage Type
New Conventional
Estimated Equity
$522,311
Purchase Details
Closed on
May 17, 2013
Sold by
Pattern Development Llc
Bought by
Lanes Brian S and Manfre Sandra
Purchase Details
Closed on
Mar 17, 2005
Sold by
Wells Fargo Bank Na
Bought by
Pattern Development Llc
Create a Home Valuation Report for This Property
The Home Valuation Report is an in-depth analysis detailing your home's value as well as a comparison with similar homes in the area
Home Values in the Area
Average Home Value in this Area
Purchase History
| Date | Buyer | Sale Price | Title Company |
|---|---|---|---|
| Brian Lane & Sandra Manfre Living Trust | -- | None Available | |
| Lanes Brian S | -- | Chicago Title Company | |
| Lanes Brian S | $616,500 | Chicago Title Company | |
| Pattern Development Llc | $220,000 | Chicago Title Co |
Source: Public Records
Mortgage History
| Date | Status | Borrower | Loan Amount |
|---|---|---|---|
| Open | Lanes Brian S | $462,000 |
Source: Public Records
Tax History Compared to Growth
Tax History
| Year | Tax Paid | Tax Assessment Tax Assessment Total Assessment is a certain percentage of the fair market value that is determined by local assessors to be the total taxable value of land and additions on the property. | Land | Improvement |
|---|---|---|---|---|
| 2025 | $10,910 | $751,898 | $227,669 | $531,229 |
| 2024 | $10,910 | $737,021 | $223,206 | $520,815 |
| 2023 | $10,689 | $729,433 | $218,830 | $510,603 |
| 2022 | $10,512 | $708,135 | $214,540 | $500,595 |
| 2021 | $10,545 | $694,114 | $210,334 | $490,780 |
| 2020 | $10,028 | $693,928 | $208,178 | $485,750 |
| 2019 | $9,684 | $680,327 | $204,098 | $476,229 |
| 2018 | $9,531 | $666,990 | $200,097 | $466,893 |
| 2017 | $9,283 | $653,911 | $196,173 | $457,738 |
| 2016 | $9,019 | $641,093 | $192,328 | $448,765 |
| 2015 | $8,905 | $631,467 | $189,440 | $442,027 |
| 2014 | $8,858 | $619,097 | $185,729 | $433,368 |
Source: Public Records
Map
Nearby Homes
- 2051 Oregon St
- 2918 Newbury St
- 2946 Harper St
- 1819 Carleton St
- 2057 Emerson St
- 1901 Parker St Unit 3
- 2110 Ashby Ave
- 2533 Grant St
- 1614 Russell St
- 2829 California St
- 1606 Derby St
- 2709 California St
- 3038 Shattuck Ave
- 3050 Shattuck Ave
- 1612 Carleton St
- 1628 Tyler St
- 1612 Parker St
- 2180 Ashby Ave
- 1538 Ashby Ave
- 2813 Martin Luther King jr Way Unit B
- 2813 Martin Luther King jr Way Unit A
- 2811 Martin Luther King jr Way
- 2809 Martin Luther King jr Way
- 2815 Martin Luther King jr Way
- 2807 Martin Luther King jr Way
- 2807 Martin Luther King Junior Way
- 1910 Stuart St
- 1915 Oregon St Unit B
- 1915 Oregon St Unit A
- 1915 Oregon St Unit C
- 1915 Oregon St
- 2801 Martin Luther King jr Way
- 1906 Stuart St
- 1912 Stuart St
- 1917 Oregon St
- 1914 Stuart St
- 2814 Martin Luther King jr Way
- 2810 Martin Luther King jr Way Unit A
- 2810 Martin Luther King jr Way