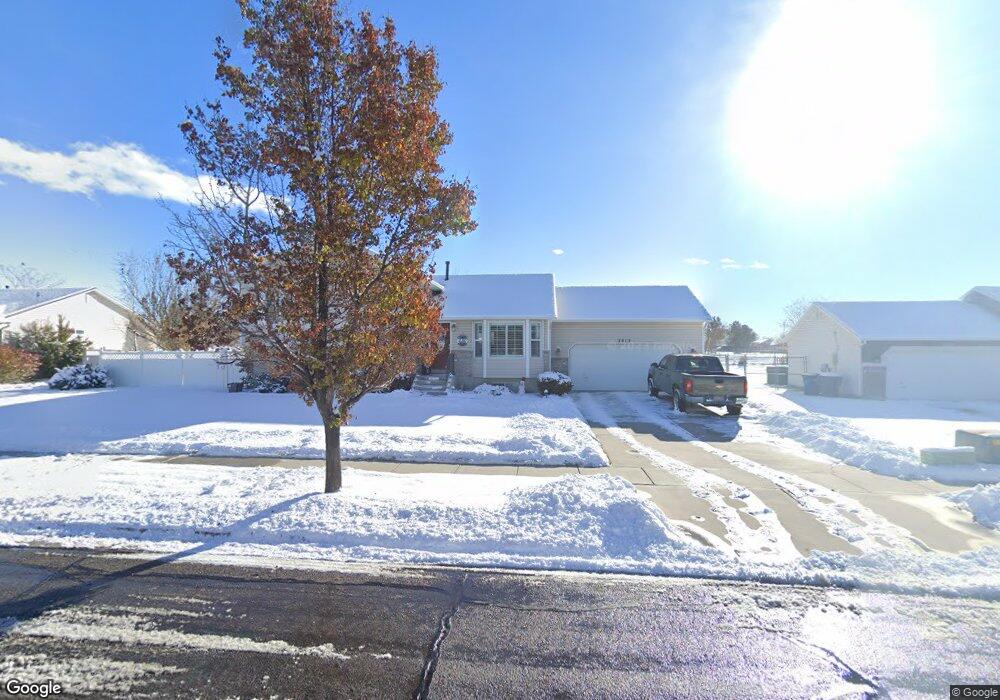
2813 W 2100 N Clearfield, UT 84015
Estimated Value: $506,026 - $562,000
6
Beds
3
Baths
2,424
Sq Ft
$216/Sq Ft
Est. Value
About This Home
This home is located at 2813 W 2100 N, Clearfield, UT 84015 and is currently estimated at $524,007, approximately $216 per square foot. 2813 W 2100 N is a home located in Davis County with nearby schools including West Clinton Elementary School, West Point Junior High School, and Clearfield High School.
Ownership History
Date
Name
Owned For
Owner Type
Purchase Details
Closed on
Oct 7, 2016
Sold by
Ferre Jared and Ferre Nancy
Bought by
Udink Rebecca and Udink Ryan
Current Estimated Value
Purchase Details
Closed on
Aug 20, 2012
Sold by
Stark Shay G and Stark Melani A
Bought by
Ferree Jared and Ferree Nancy
Home Financials for this Owner
Home Financials are based on the most recent Mortgage that was taken out on this home.
Original Mortgage
$168,300
Interest Rate
3.53%
Mortgage Type
New Conventional
Purchase Details
Closed on
Jul 30, 2002
Sold by
Woodside Homes Corp
Bought by
Stark Shay G and Stark Melani A
Home Financials for this Owner
Home Financials are based on the most recent Mortgage that was taken out on this home.
Original Mortgage
$110,000
Interest Rate
6.51%
Create a Home Valuation Report for This Property
The Home Valuation Report is an in-depth analysis detailing your home's value as well as a comparison with similar homes in the area
Home Values in the Area
Average Home Value in this Area
Purchase History
| Date | Buyer | Sale Price | Title Company |
|---|---|---|---|
| Udink Rebecca | -- | None Available | |
| Ferree Jared | -- | Title Guarantee | |
| Stark Shay G | -- | First American Title Co |
Source: Public Records
Mortgage History
| Date | Status | Borrower | Loan Amount |
|---|---|---|---|
| Previous Owner | Ferree Jared | $168,300 | |
| Previous Owner | Stark Shay G | $110,000 |
Source: Public Records
Tax History Compared to Growth
Tax History
| Year | Tax Paid | Tax Assessment Tax Assessment Total Assessment is a certain percentage of the fair market value that is determined by local assessors to be the total taxable value of land and additions on the property. | Land | Improvement |
|---|---|---|---|---|
| 2025 | $2,614 | $251,350 | $114,391 | $136,959 |
| 2024 | $2,646 | $255,750 | $122,992 | $132,758 |
| 2023 | $2,387 | $427,000 | $144,778 | $282,222 |
| 2022 | $2,591 | $256,300 | $82,735 | $173,565 |
| 2021 | $2,357 | $346,000 | $113,546 | $232,454 |
| 2020 | $2,072 | $301,000 | $102,170 | $198,830 |
| 2019 | $2,015 | $286,000 | $109,022 | $176,978 |
| 2018 | $1,865 | $260,000 | $90,801 | $169,199 |
| 2016 | $1,565 | $112,640 | $36,480 | $76,160 |
| 2015 | $1,547 | $105,875 | $36,480 | $69,395 |
| 2014 | $1,536 | $106,780 | $36,480 | $70,300 |
| 2013 | -- | $100,871 | $31,635 | $69,236 |
Source: Public Records
Map
Nearby Homes
- 1958 N 2750 W
- 3941 W 1800 N
- Harvard Plan at Summerfield - Enclave
- 2208 W 2615 N
- Linden Plan at Summerfield - Vista
- Yale Plan at Summerfield - Enclave
- Gambel Oak Plan at Summerfield - Vista
- Cedar Plan at Summerfield - Vista
- Elm Plan at Summerfield - Vista
- Princeton Plan at Summerfield - Enclave
- Cambridge Plan at Summerfield - Enclave
- Cornell Plan at Summerfield - Enclave
- Sycamore Plan at Summerfield - Vista
- Berkeley Plan at Summerfield - Enclave
- Birch Plan at Summerfield - Vista
- Stanford Plan at Summerfield - Enclave
- 2322 N 2500 W
- 2434 W 2250 N
- 2377 W 2120 N
- 339 N 3250 W Unit 12